Cities with the Lowest Poverty Level Among Children Under the Age of 16 in Missouri
RELATED REPORTS & OPTIONS
Lowest Poverty | Child 0-16
Missouri
Compare Cities
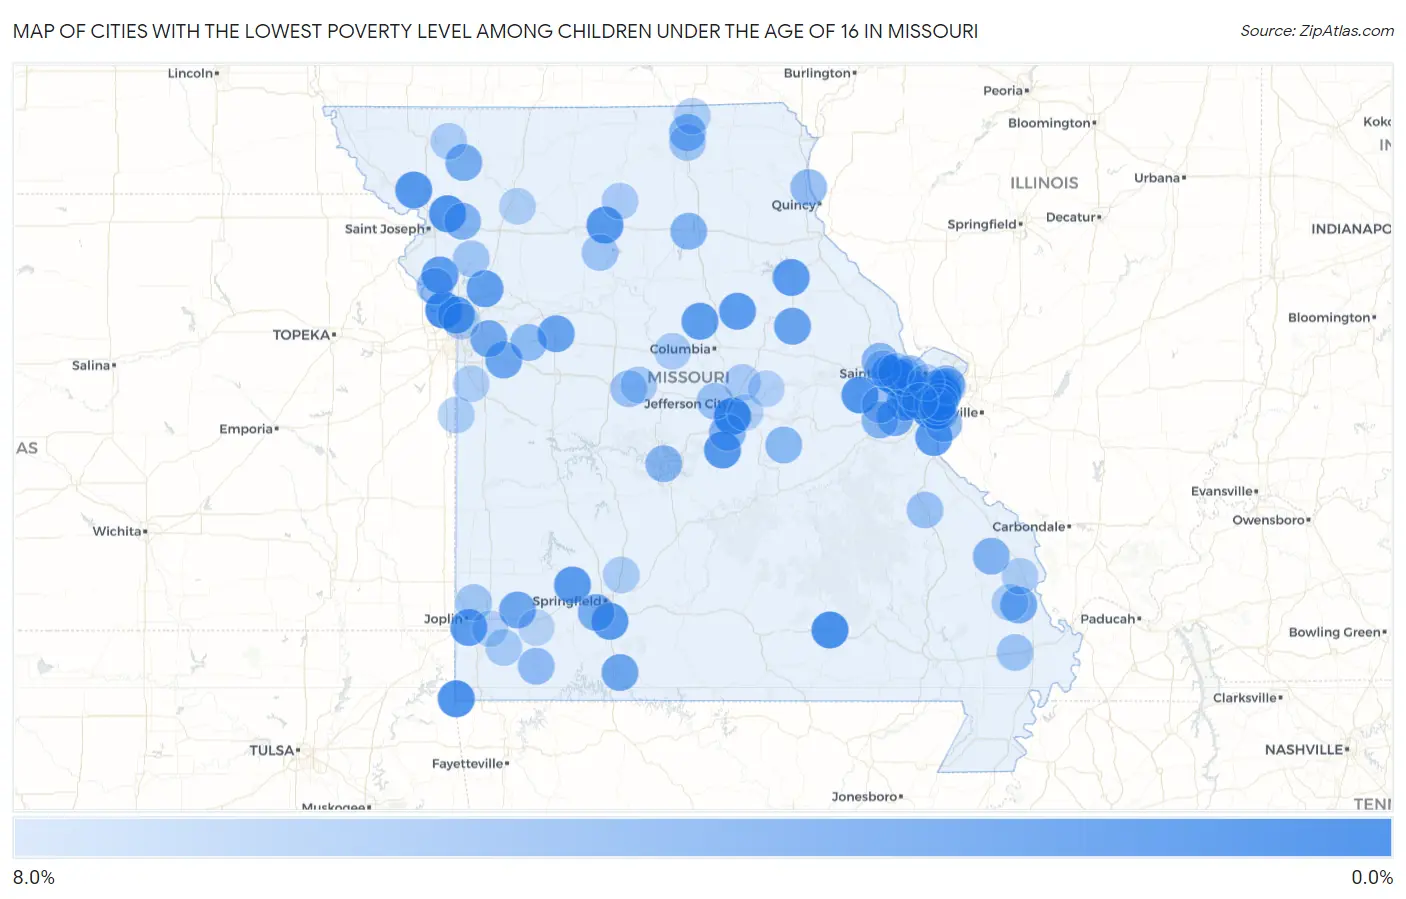
Map of Cities with the Lowest Poverty Level Among Children Under the Age of 16 in Missouri
8.0%
0.0%
Cities with the Lowest Poverty Level Among Children Under the Age of 16 in Missouri
| City | Child Poverty | vs State | vs National | |
| 1. | Sunset Hills | 0.13% | 16.9%(-16.8)#1 | 16.9%(-16.8)#5 |
| 2. | Warson Woods | 0.59% | 16.9%(-16.3)#2 | 16.9%(-16.3)#92 |
| 3. | Wardsville | 0.63% | 16.9%(-16.3)#3 | 16.9%(-16.3)#111 |
| 4. | Dardenne Prairie | 0.70% | 16.9%(-16.2)#4 | 16.9%(-16.2)#136 |
| 5. | Parkville | 0.74% | 16.9%(-16.2)#5 | 16.9%(-16.2)#149 |
| 6. | Winona | 1.0% | 16.9%(-15.9)#6 | 16.9%(-15.9)#289 |
| 7. | Frontenac | 1.1% | 16.9%(-15.9)#7 | 16.9%(-15.9)#309 |
| 8. | Ellisville | 1.1% | 16.9%(-15.8)#8 | 16.9%(-15.8)#366 |
| 9. | Southwest City | 1.2% | 16.9%(-15.8)#9 | 16.9%(-15.8)#373 |
| 10. | Clayton | 1.2% | 16.9%(-15.8)#10 | 16.9%(-15.8)#375 |
| 11. | Fenton | 1.2% | 16.9%(-15.8)#11 | 16.9%(-15.8)#384 |
| 12. | Town And Country | 1.2% | 16.9%(-15.7)#12 | 16.9%(-15.7)#395 |
| 13. | Cosby | 1.4% | 16.9%(-15.6)#13 | 16.9%(-15.6)#469 |
| 14. | Richmond Heights | 1.4% | 16.9%(-15.5)#14 | 16.9%(-15.5)#503 |
| 15. | Marthasville | 1.4% | 16.9%(-15.5)#15 | 16.9%(-15.5)#510 |
| 16. | Olivette | 1.4% | 16.9%(-15.5)#16 | 16.9%(-15.5)#511 |
| 17. | Fillmore | 1.6% | 16.9%(-15.3)#17 | 16.9%(-15.4)#615 |
| 18. | St Elizabeth | 1.6% | 16.9%(-15.3)#18 | 16.9%(-15.3)#650 |
| 19. | Lake St Louis | 1.7% | 16.9%(-15.3)#19 | 16.9%(-15.3)#658 |
| 20. | Meadville | 1.7% | 16.9%(-15.3)#20 | 16.9%(-15.3)#676 |
| 21. | Fremont Hills | 1.7% | 16.9%(-15.2)#21 | 16.9%(-15.2)#698 |
| 22. | Northmoor | 1.7% | 16.9%(-15.2)#22 | 16.9%(-15.2)#710 |
| 23. | Ash Grove | 1.8% | 16.9%(-15.2)#23 | 16.9%(-15.2)#745 |
| 24. | Shoal Creek Estates | 1.8% | 16.9%(-15.1)#24 | 16.9%(-15.1)#767 |
| 25. | Barnhart | 1.8% | 16.9%(-15.1)#25 | 16.9%(-15.1)#773 |
| 26. | Perry | 1.9% | 16.9%(-15.1)#26 | 16.9%(-15.1)#796 |
| 27. | Centralia | 1.9% | 16.9%(-15.1)#27 | 16.9%(-15.1)#813 |
| 28. | Glendale | 1.9% | 16.9%(-15.0)#28 | 16.9%(-15.1)#819 |
| 29. | Camden Point | 1.9% | 16.9%(-15.0)#29 | 16.9%(-15.0)#871 |
| 30. | Harrisburg | 1.9% | 16.9%(-15.0)#30 | 16.9%(-15.0)#872 |
| 31. | Kearney | 2.1% | 16.9%(-14.8)#31 | 16.9%(-14.8)#997 |
| 32. | Concord | 2.2% | 16.9%(-14.8)#32 | 16.9%(-14.8)#1,015 |
| 33. | Higginsville | 2.4% | 16.9%(-14.5)#33 | 16.9%(-14.5)#1,190 |
| 34. | Martinsburg | 2.4% | 16.9%(-14.5)#34 | 16.9%(-14.5)#1,192 |
| 35. | Lone Jack | 2.7% | 16.9%(-14.2)#35 | 16.9%(-14.2)#1,402 |
| 36. | La Russell | 2.7% | 16.9%(-14.2)#36 | 16.9%(-14.2)#1,407 |
| 37. | Rockaway Beach | 2.8% | 16.9%(-14.2)#37 | 16.9%(-14.2)#1,458 |
| 38. | Pacific | 2.9% | 16.9%(-14.1)#38 | 16.9%(-14.1)#1,510 |
| 39. | Wildwood | 3.0% | 16.9%(-13.9)#39 | 16.9%(-14.0)#1,590 |
| 40. | Lake Tapawingo | 3.1% | 16.9%(-13.9)#40 | 16.9%(-13.9)#1,648 |
| 41. | Briarwood Estates | 3.1% | 16.9%(-13.9)#41 | 16.9%(-13.9)#1,659 |
| 42. | Chaffee | 3.1% | 16.9%(-13.9)#42 | 16.9%(-13.9)#1,661 |
| 43. | Stanberry | 3.2% | 16.9%(-13.7)#43 | 16.9%(-13.7)#1,753 |
| 44. | Battlefield | 3.2% | 16.9%(-13.7)#44 | 16.9%(-13.7)#1,756 |
| 45. | Chesterfield | 3.3% | 16.9%(-13.7)#45 | 16.9%(-13.7)#1,797 |
| 46. | Kirkwood | 3.5% | 16.9%(-13.4)#46 | 16.9%(-13.4)#1,964 |
| 47. | Clarksdale | 3.7% | 16.9%(-13.3)#47 | 16.9%(-13.3)#2,064 |
| 48. | Queen City | 3.7% | 16.9%(-13.2)#48 | 16.9%(-13.2)#2,082 |
| 49. | St Thomas | 3.7% | 16.9%(-13.2)#49 | 16.9%(-13.2)#2,087 |
| 50. | Sedgewickville | 3.7% | 16.9%(-13.2)#50 | 16.9%(-13.2)#2,090 |
| 51. | Cottleville | 3.7% | 16.9%(-13.2)#51 | 16.9%(-13.2)#2,117 |
| 52. | Bevier | 3.7% | 16.9%(-13.2)#52 | 16.9%(-13.2)#2,120 |
| 53. | Sunrise Beach | 3.9% | 16.9%(-13.0)#53 | 16.9%(-13.0)#2,203 |
| 54. | Villa Ridge | 4.0% | 16.9%(-13.0)#54 | 16.9%(-13.0)#2,247 |
| 55. | Flint Hill | 4.0% | 16.9%(-13.0)#55 | 16.9%(-13.0)#2,251 |
| 56. | Odessa | 4.1% | 16.9%(-12.8)#56 | 16.9%(-12.8)#2,346 |
| 57. | Oakville | 4.1% | 16.9%(-12.8)#57 | 16.9%(-12.8)#2,349 |
| 58. | Belle | 4.1% | 16.9%(-12.8)#58 | 16.9%(-12.8)#2,366 |
| 59. | Hanley Hills | 4.1% | 16.9%(-12.8)#59 | 16.9%(-12.8)#2,371 |
| 60. | Normandy | 4.1% | 16.9%(-12.8)#60 | 16.9%(-12.8)#2,384 |
| 61. | Brentwood | 4.2% | 16.9%(-12.7)#61 | 16.9%(-12.7)#2,439 |
| 62. | La Grange | 4.3% | 16.9%(-12.6)#62 | 16.9%(-12.6)#2,484 |
| 63. | Butterfield | 4.3% | 16.9%(-12.6)#63 | 16.9%(-12.6)#2,517 |
| 64. | Tracy | 4.3% | 16.9%(-12.6)#64 | 16.9%(-12.6)#2,522 |
| 65. | Sappington | 4.4% | 16.9%(-12.6)#65 | 16.9%(-12.6)#2,529 |
| 66. | St Peters | 4.6% | 16.9%(-12.3)#66 | 16.9%(-12.3)#2,702 |
| 67. | Leadington | 4.8% | 16.9%(-12.1)#67 | 16.9%(-12.1)#2,849 |
| 68. | Augusta | 4.8% | 16.9%(-12.1)#68 | 16.9%(-12.1)#2,851 |
| 69. | Smithton | 4.9% | 16.9%(-12.1)#69 | 16.9%(-12.1)#2,864 |
| 70. | St Martins | 4.9% | 16.9%(-12.1)#70 | 16.9%(-12.1)#2,871 |
| 71. | Hale | 4.9% | 16.9%(-12.0)#71 | 16.9%(-12.0)#2,927 |
| 72. | Morehouse | 5.0% | 16.9%(-12.0)#72 | 16.9%(-12.0)#2,955 |
| 73. | Beverly Hills | 5.0% | 16.9%(-11.9)#73 | 16.9%(-11.9)#2,973 |
| 74. | Wentzville | 5.0% | 16.9%(-11.9)#74 | 16.9%(-11.9)#2,998 |
| 75. | Greentop | 5.1% | 16.9%(-11.9)#75 | 16.9%(-11.9)#3,015 |
| 76. | Plattsburg | 5.1% | 16.9%(-11.8)#76 | 16.9%(-11.8)#3,076 |
| 77. | O Fallon | 5.2% | 16.9%(-11.7)#77 | 16.9%(-11.7)#3,121 |
| 78. | Oronogo | 5.2% | 16.9%(-11.7)#78 | 16.9%(-11.7)#3,124 |
| 79. | Crestwood | 5.3% | 16.9%(-11.6)#79 | 16.9%(-11.6)#3,201 |
| 80. | Delta | 5.4% | 16.9%(-11.5)#80 | 16.9%(-11.5)#3,244 |
| 81. | Otterville | 5.4% | 16.9%(-11.5)#81 | 16.9%(-11.5)#3,245 |
| 82. | Newtonia | 5.4% | 16.9%(-11.5)#82 | 16.9%(-11.5)#3,247 |
| 83. | North Kansas City | 5.5% | 16.9%(-11.5)#83 | 16.9%(-11.5)#3,289 |
| 84. | Windsor Place | 5.5% | 16.9%(-11.4)#84 | 16.9%(-11.4)#3,305 |
| 85. | New Bloomfield | 5.6% | 16.9%(-11.4)#85 | 16.9%(-11.4)#3,342 |
| 86. | Purdin | 5.6% | 16.9%(-11.4)#86 | 16.9%(-11.4)#3,370 |
| 87. | Fair Grove | 5.6% | 16.9%(-11.3)#87 | 16.9%(-11.3)#3,405 |
| 88. | Webster Groves | 5.6% | 16.9%(-11.3)#88 | 16.9%(-11.3)#3,416 |
| 89. | Jackson | 5.6% | 16.9%(-11.3)#89 | 16.9%(-11.3)#3,421 |
| 90. | Ravenwood | 5.7% | 16.9%(-11.3)#90 | 16.9%(-11.3)#3,439 |
| 91. | Drexel | 5.7% | 16.9%(-11.3)#91 | 16.9%(-11.3)#3,443 |
| 92. | Peculiar | 5.7% | 16.9%(-11.3)#92 | 16.9%(-11.3)#3,446 |
| 93. | Lake Viking | 5.7% | 16.9%(-11.2)#93 | 16.9%(-11.2)#3,471 |
| 94. | Lancaster | 5.7% | 16.9%(-11.2)#94 | 16.9%(-11.2)#3,500 |
| 95. | Diamond | 5.9% | 16.9%(-11.1)#95 | 16.9%(-11.1)#3,586 |
| 96. | Taos | 5.9% | 16.9%(-11.0)#96 | 16.9%(-11.0)#3,618 |
| 97. | Maryland Heights | 5.9% | 16.9%(-11.0)#97 | 16.9%(-11.0)#3,639 |
| 98. | Mokane | 6.0% | 16.9%(-11.0)#98 | 16.9%(-11.0)#3,674 |
| 99. | Winchester | 6.0% | 16.9%(-10.9)#99 | 16.9%(-10.9)#3,713 |
| 100. | Freistatt | 6.1% | 16.9%(-10.8)#100 | 16.9%(-10.8)#3,785 |
Common Questions
What are the Top 10 Cities with the Lowest Poverty Level Among Children Under the Age of 16 in Missouri?
Top 10 Cities with the Lowest Poverty Level Among Children Under the Age of 16 in Missouri are:
#1
0.13%
#2
0.59%
#3
0.63%
#4
0.70%
#5
0.74%
#6
1.0%
#7
1.1%
#8
1.1%
#9
1.2%
#10
1.2%
What city has the Lowest Poverty Level Among Children Under the Age of 16 in Missouri?
Sunset Hills has the Lowest Poverty Level Among Children Under the Age of 16 in Missouri with 0.13%.
What is the Poverty Level Among Children Under the Age of 16 in the State of Missouri?
Poverty Level Among Children Under the Age of 16 in Missouri is 16.9%.
What is the Poverty Level Among Children Under the Age of 16 in the United States?
Poverty Level Among Children Under the Age of 16 in the United States is 16.9%.