Cities with the Lowest Poverty Level Among Children Under the Age of 16 in Arkansas
RELATED REPORTS & OPTIONS
Lowest Poverty | Child 0-16
Arkansas
Compare Cities
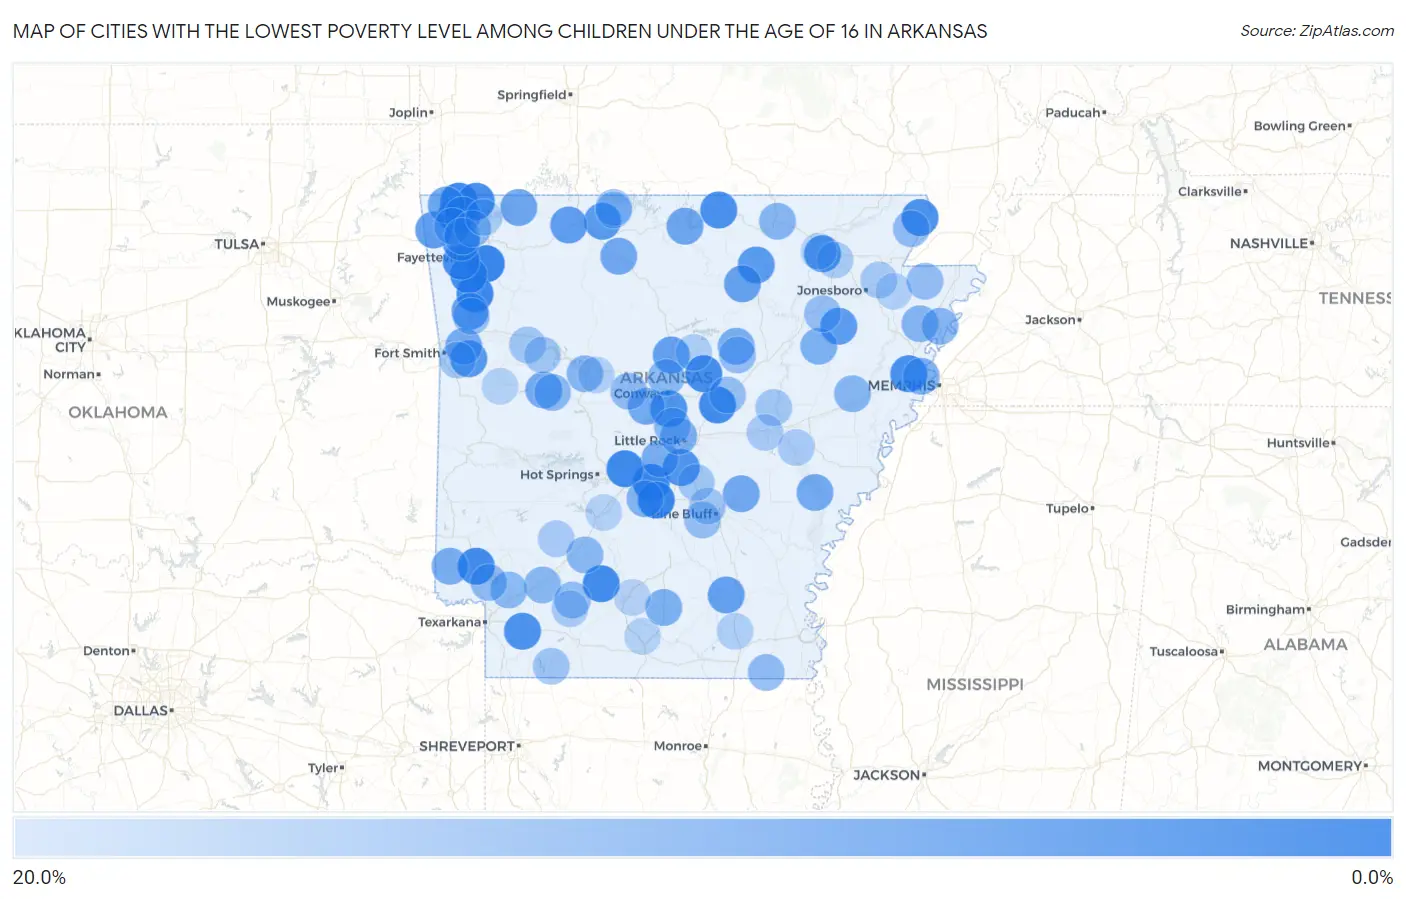
Map of Cities with the Lowest Poverty Level Among Children Under the Age of 16 in Arkansas
20.0%
0.0%
Cities with the Lowest Poverty Level Among Children Under the Age of 16 in Arkansas
| City | Child Poverty | vs State | vs National | |
| 1. | Bella Vista | 0.61% | 22.8%(-22.1)#1 | 16.9%(-16.3)#103 |
| 2. | Elkins | 0.67% | 22.8%(-22.1)#2 | 16.9%(-16.3)#123 |
| 3. | Tull | 1.1% | 22.8%(-21.7)#3 | 16.9%(-15.9)#335 |
| 4. | Prattsville | 1.2% | 22.8%(-21.6)#4 | 16.9%(-15.7)#385 |
| 5. | Winslow | 1.4% | 22.8%(-21.4)#5 | 16.9%(-15.6)#480 |
| 6. | Lonsdale | 1.7% | 22.8%(-21.1)#6 | 16.9%(-15.2)#694 |
| 7. | Centerton | 1.7% | 22.8%(-21.0)#7 | 16.9%(-15.2)#731 |
| 8. | Chidester | 1.8% | 22.8%(-21.0)#8 | 16.9%(-15.2)#753 |
| 9. | Austin | 1.9% | 22.8%(-20.9)#9 | 16.9%(-15.1)#811 |
| 10. | Ben Lomond | 1.9% | 22.8%(-20.8)#10 | 16.9%(-15.0)#855 |
| 11. | Pea Ridge | 2.1% | 22.8%(-20.6)#11 | 16.9%(-14.8)#1,008 |
| 12. | West Fork | 2.2% | 22.8%(-20.5)#12 | 16.9%(-14.7)#1,063 |
| 13. | Mount Vernon | 2.5% | 22.8%(-20.2)#13 | 16.9%(-14.4)#1,251 |
| 14. | Farmington | 2.6% | 22.8%(-20.2)#14 | 16.9%(-14.4)#1,293 |
| 15. | Viola | 2.8% | 22.8%(-20.0)#15 | 16.9%(-14.2)#1,445 |
| 16. | Crawfordsville | 2.9% | 22.8%(-19.9)#16 | 16.9%(-14.0)#1,545 |
| 17. | Garland | 3.3% | 22.8%(-19.4)#17 | 16.9%(-13.6)#1,838 |
| 18. | Greenway | 3.3% | 22.8%(-19.4)#18 | 16.9%(-13.6)#1,840 |
| 19. | Mayflower | 3.7% | 22.8%(-19.1)#19 | 16.9%(-13.3)#2,067 |
| 20. | Portia | 3.7% | 22.8%(-19.1)#20 | 16.9%(-13.2)#2,084 |
| 21. | East End | 3.8% | 22.8%(-19.0)#21 | 16.9%(-13.1)#2,152 |
| 22. | Tontitown | 4.0% | 22.8%(-18.8)#22 | 16.9%(-12.9)#2,272 |
| 23. | Lavaca | 4.5% | 22.8%(-18.3)#23 | 16.9%(-12.5)#2,604 |
| 24. | Bergman | 4.8% | 22.8%(-18.0)#24 | 16.9%(-12.2)#2,802 |
| 25. | Sidney | 4.9% | 22.8%(-17.9)#25 | 16.9%(-12.1)#2,888 |
| 26. | Waldenburg | 5.0% | 22.8%(-17.8)#26 | 16.9%(-11.9)#2,986 |
| 27. | Alpena | 5.5% | 22.8%(-17.3)#27 | 16.9%(-11.4)#3,301 |
| 28. | Chester | 5.6% | 22.8%(-17.2)#28 | 16.9%(-11.4)#3,369 |
| 29. | Gentry | 5.6% | 22.8%(-17.2)#29 | 16.9%(-11.3)#3,389 |
| 30. | Wilmar | 6.0% | 22.8%(-16.8)#30 | 16.9%(-11.0)#3,672 |
| 31. | Damascus | 6.0% | 22.8%(-16.8)#31 | 16.9%(-10.9)#3,699 |
| 32. | Cushman | 6.3% | 22.8%(-16.4)#32 | 16.9%(-10.6)#3,922 |
| 33. | Gravette | 7.0% | 22.8%(-15.7)#33 | 16.9%(-9.93)#4,383 |
| 34. | Briarcliff | 7.4% | 22.8%(-15.4)#34 | 16.9%(-9.53)#4,657 |
| 35. | Eureka Springs | 7.4% | 22.8%(-15.3)#35 | 16.9%(-9.49)#4,674 |
| 36. | Wabbaseka | 7.7% | 22.8%(-15.1)#36 | 16.9%(-9.25)#4,830 |
| 37. | Pindall | 7.7% | 22.8%(-15.1)#37 | 16.9%(-9.25)#4,840 |
| 38. | St Charles | 7.8% | 22.8%(-14.9)#38 | 16.9%(-9.10)#4,940 |
| 39. | Havana | 8.0% | 22.8%(-14.7)#39 | 16.9%(-8.92)#5,043 |
| 40. | Kibler | 8.0% | 22.8%(-14.7)#40 | 16.9%(-8.91)#5,048 |
| 41. | Bigelow | 8.0% | 22.8%(-14.7)#41 | 16.9%(-8.90)#5,054 |
| 42. | Bryant | 8.5% | 22.8%(-14.2)#42 | 16.9%(-8.40)#5,387 |
| 43. | Pangburn | 8.6% | 22.8%(-14.1)#43 | 16.9%(-8.30)#5,455 |
| 44. | Bentonville | 8.7% | 22.8%(-14.1)#44 | 16.9%(-8.27)#5,471 |
| 45. | Winthrop | 8.7% | 22.8%(-14.1)#45 | 16.9%(-8.24)#5,501 |
| 46. | Beedeville | 9.1% | 22.8%(-13.7)#46 | 16.9%(-7.85)#5,808 |
| 47. | Marion | 9.1% | 22.8%(-13.6)#47 | 16.9%(-7.82)#5,817 |
| 48. | Hampton | 9.3% | 22.8%(-13.5)#48 | 16.9%(-7.66)#5,908 |
| 49. | Cammack Village | 9.4% | 22.8%(-13.3)#49 | 16.9%(-7.51)#6,006 |
| 50. | Dyess | 9.8% | 22.8%(-12.9)#50 | 16.9%(-7.10)#6,246 |
| 51. | Poyen | 10.0% | 22.8%(-12.8)#51 | 16.9%(-6.94)#6,364 |
| 52. | Dardanelle | 10.4% | 22.8%(-12.4)#52 | 16.9%(-6.58)#6,573 |
| 53. | Caldwell | 10.5% | 22.8%(-12.3)#53 | 16.9%(-6.46)#6,643 |
| 54. | Wilson | 10.5% | 22.8%(-12.2)#54 | 16.9%(-6.41)#6,663 |
| 55. | Hardy | 10.5% | 22.8%(-12.2)#55 | 16.9%(-6.41)#6,665 |
| 56. | Highfill | 10.6% | 22.8%(-12.2)#56 | 16.9%(-6.38)#6,686 |
| 57. | Belleville | 10.6% | 22.8%(-12.2)#57 | 16.9%(-6.33)#6,724 |
| 58. | Gurdon | 10.8% | 22.8%(-12.0)#58 | 16.9%(-6.18)#6,813 |
| 59. | Perrytown | 10.8% | 22.8%(-12.0)#59 | 16.9%(-6.16)#6,824 |
| 60. | Lowell | 10.8% | 22.8%(-11.9)#60 | 16.9%(-6.11)#6,851 |
| 61. | Maumelle | 10.9% | 22.8%(-11.9)#61 | 16.9%(-6.05)#6,902 |
| 62. | Wooster | 11.1% | 22.8%(-11.7)#62 | 16.9%(-5.86)#7,011 |
| 63. | Mcnab | 11.1% | 22.8%(-11.6)#63 | 16.9%(-5.83)#7,074 |
| 64. | Rector | 11.4% | 22.8%(-11.4)#64 | 16.9%(-5.56)#7,221 |
| 65. | Oppelo | 11.4% | 22.8%(-11.4)#65 | 16.9%(-5.55)#7,224 |
| 66. | Wilmot | 11.5% | 22.8%(-11.2)#66 | 16.9%(-5.40)#7,305 |
| 67. | Yarborough Landing | 11.6% | 22.8%(-11.1)#67 | 16.9%(-5.31)#7,361 |
| 68. | Rosston | 11.8% | 22.8%(-11.0)#68 | 16.9%(-5.17)#7,445 |
| 69. | Letona | 11.9% | 22.8%(-10.9)#69 | 16.9%(-5.03)#7,533 |
| 70. | Manila | 12.0% | 22.8%(-10.8)#70 | 16.9%(-4.97)#7,569 |
| 71. | Grubbs | 12.0% | 22.8%(-10.8)#71 | 16.9%(-4.94)#7,593 |
| 72. | Mountainburg | 12.2% | 22.8%(-10.5)#72 | 16.9%(-4.72)#7,724 |
| 73. | Sulphur Springs | 12.3% | 22.8%(-10.4)#73 | 16.9%(-4.60)#7,790 |
| 74. | Beebe | 12.4% | 22.8%(-10.4)#74 | 16.9%(-4.59)#7,800 |
| 75. | Lead Hill | 12.7% | 22.8%(-10.0)#75 | 16.9%(-4.23)#8,004 |
| 76. | Taylor | 13.4% | 22.8%(-9.37)#76 | 16.9%(-3.55)#8,376 |
| 77. | White Hall | 13.5% | 22.8%(-9.29)#77 | 16.9%(-3.47)#8,417 |
| 78. | Elm Springs | 13.5% | 22.8%(-9.24)#78 | 16.9%(-3.43)#8,440 |
| 79. | Coal Hill | 13.6% | 22.8%(-9.12)#79 | 16.9%(-3.30)#8,504 |
| 80. | Redfield | 13.7% | 22.8%(-9.03)#80 | 16.9%(-3.21)#8,548 |
| 81. | Des Arc | 13.8% | 22.8%(-8.91)#81 | 16.9%(-3.09)#8,621 |
| 82. | Scranton | 13.9% | 22.8%(-8.87)#82 | 16.9%(-3.05)#8,638 |
| 83. | Barling | 14.2% | 22.8%(-8.61)#83 | 16.9%(-2.79)#8,777 |
| 84. | South Lead Hill | 14.3% | 22.8%(-8.47)#84 | 16.9%(-2.65)#8,888 |
| 85. | Brookland | 14.4% | 22.8%(-8.32)#85 | 16.9%(-2.50)#8,950 |
| 86. | Antoine | 14.6% | 22.8%(-8.20)#86 | 16.9%(-2.38)#9,002 |
| 87. | Willisville | 14.6% | 22.8%(-8.17)#87 | 16.9%(-2.36)#9,020 |
| 88. | Hazen | 14.6% | 22.8%(-8.12)#88 | 16.9%(-2.30)#9,041 |
| 89. | Clarendon | 14.7% | 22.8%(-8.06)#89 | 16.9%(-2.25)#9,069 |
| 90. | Hoxie | 14.9% | 22.8%(-7.84)#90 | 16.9%(-2.02)#9,187 |
| 91. | Quitman | 15.2% | 22.8%(-7.61)#91 | 16.9%(-1.79)#9,303 |
| 92. | Prairie Creek | 15.2% | 22.8%(-7.59)#92 | 16.9%(-1.78)#9,316 |
| 93. | Fountain Hill | 15.4% | 22.8%(-7.37)#93 | 16.9%(-1.55)#9,448 |
| 94. | Lake City | 15.6% | 22.8%(-7.16)#94 | 16.9%(-1.35)#9,553 |
| 95. | Pottsville | 15.7% | 22.8%(-7.06)#95 | 16.9%(-1.24)#9,600 |
| 96. | Friendship | 15.8% | 22.8%(-6.97)#96 | 16.9%(-1.15)#9,646 |
| 97. | Norphlet | 15.8% | 22.8%(-6.91)#97 | 16.9%(-1.09)#9,681 |
| 98. | Booneville | 15.9% | 22.8%(-6.83)#98 | 16.9%(-1.01)#9,728 |
| 99. | East Camden | 16.2% | 22.8%(-6.58)#99 | 16.9%(-0.763)#9,862 |
| 100. | Black Rock | 16.2% | 22.8%(-6.58)#100 | 16.9%(-0.763)#9,864 |
Common Questions
What are the Top 10 Cities with the Lowest Poverty Level Among Children Under the Age of 16 in Arkansas?
Top 10 Cities with the Lowest Poverty Level Among Children Under the Age of 16 in Arkansas are:
#1
0.61%
#2
0.67%
#3
1.1%
#4
1.2%
#5
1.4%
#6
1.7%
#7
1.7%
#8
1.8%
#9
1.9%
#10
1.9%
What city has the Lowest Poverty Level Among Children Under the Age of 16 in Arkansas?
Bella Vista has the Lowest Poverty Level Among Children Under the Age of 16 in Arkansas with 0.61%.
What is the Poverty Level Among Children Under the Age of 16 in the State of Arkansas?
Poverty Level Among Children Under the Age of 16 in Arkansas is 22.8%.
What is the Poverty Level Among Children Under the Age of 16 in the United States?
Poverty Level Among Children Under the Age of 16 in the United States is 16.9%.