Cities with the Lowest Poverty Level Among Children Under the Age of 16 in Maryland
RELATED REPORTS & OPTIONS
Lowest Poverty | Child 0-16
Maryland
Compare Cities
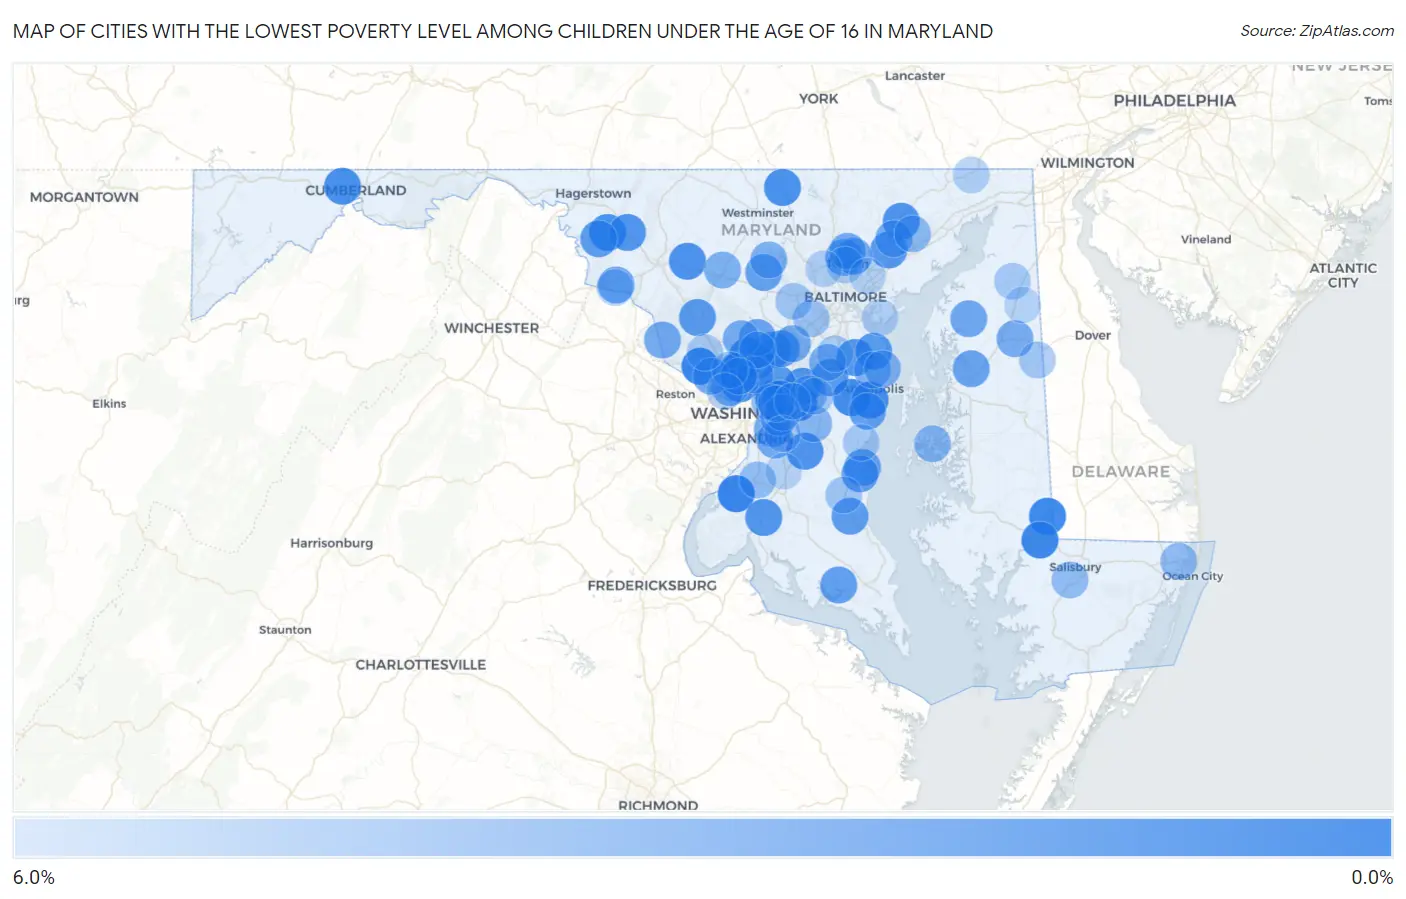
Map of Cities with the Lowest Poverty Level Among Children Under the Age of 16 in Maryland
6.0%
0.0%
Cities with the Lowest Poverty Level Among Children Under the Age of 16 in Maryland
| City | Child Poverty | vs State | vs National | |
| 1. | Bryans Road | 0.46% | 12.0%(-11.5)#1 | 16.9%(-16.5)#53 |
| 2. | Travilah | 0.57% | 12.0%(-11.4)#2 | 16.9%(-16.4)#81 |
| 3. | Bladensburg | 0.58% | 12.0%(-11.4)#3 | 16.9%(-16.4)#88 |
| 4. | Sharptown | 0.68% | 12.0%(-11.3)#4 | 16.9%(-16.3)#126 |
| 5. | Mardela Springs | 0.70% | 12.0%(-11.3)#5 | 16.9%(-16.2)#134 |
| 6. | Abingdon | 0.75% | 12.0%(-11.2)#6 | 16.9%(-16.2)#156 |
| 7. | Mitchellville | 0.90% | 12.0%(-11.1)#7 | 16.9%(-16.0)#241 |
| 8. | Riva | 0.94% | 12.0%(-11.0)#8 | 16.9%(-16.0)#251 |
| 9. | Annapolis Neck | 0.99% | 12.0%(-11.0)#9 | 16.9%(-16.0)#275 |
| 10. | Brown Station | 0.99% | 12.0%(-11.0)#10 | 16.9%(-15.9)#276 |
| 11. | Chevy Chase | 1.00% | 12.0%(-11.0)#11 | 16.9%(-15.9)#279 |
| 12. | Layhill | 1.2% | 12.0%(-10.8)#12 | 16.9%(-15.8)#380 |
| 13. | Manchester | 1.2% | 12.0%(-10.7)#13 | 16.9%(-15.7)#406 |
| 14. | North Kensington | 1.3% | 12.0%(-10.7)#14 | 16.9%(-15.7)#425 |
| 15. | La Vale | 1.3% | 12.0%(-10.7)#15 | 16.9%(-15.7)#436 |
| 16. | Boonsboro | 1.3% | 12.0%(-10.7)#16 | 16.9%(-15.7)#440 |
| 17. | Linganore | 1.3% | 12.0%(-10.6)#17 | 16.9%(-15.6)#467 |
| 18. | Bel Air North | 1.4% | 12.0%(-10.5)#18 | 16.9%(-15.5)#517 |
| 19. | Marlton | 1.5% | 12.0%(-10.5)#19 | 16.9%(-15.5)#539 |
| 20. | Myersville | 1.5% | 12.0%(-10.5)#20 | 16.9%(-15.4)#570 |
| 21. | Severna Park | 1.5% | 12.0%(-10.4)#21 | 16.9%(-15.4)#587 |
| 22. | Glenn Dale | 1.6% | 12.0%(-10.4)#22 | 16.9%(-15.4)#600 |
| 23. | La Plata | 1.6% | 12.0%(-10.4)#23 | 16.9%(-15.3)#618 |
| 24. | Burtonsville | 1.8% | 12.0%(-10.2)#24 | 16.9%(-15.1)#761 |
| 25. | Kingsville | 1.8% | 12.0%(-10.1)#25 | 16.9%(-15.1)#792 |
| 26. | Clarksburg | 1.9% | 12.0%(-10.1)#26 | 16.9%(-15.0)#829 |
| 27. | Lake Shore | 1.9% | 12.0%(-10.1)#27 | 16.9%(-15.0)#830 |
| 28. | Berwyn Heights | 1.9% | 12.0%(-10.0)#28 | 16.9%(-15.0)#861 |
| 29. | West Laurel | 2.0% | 12.0%(-9.97)#29 | 16.9%(-14.9)#906 |
| 30. | Chevy Chase View | 2.0% | 12.0%(-9.95)#30 | 16.9%(-14.9)#924 |
| 31. | Keedysville | 2.1% | 12.0%(-9.89)#31 | 16.9%(-14.9)#959 |
| 32. | Crofton | 2.1% | 12.0%(-9.87)#32 | 16.9%(-14.8)#975 |
| 33. | Prince Frederick | 2.1% | 12.0%(-9.86)#33 | 16.9%(-14.8)#983 |
| 34. | Colesville | 2.1% | 12.0%(-9.84)#34 | 16.9%(-14.8)#992 |
| 35. | Leonardtown | 2.2% | 12.0%(-9.72)#35 | 16.9%(-14.7)#1,070 |
| 36. | Mayo | 2.3% | 12.0%(-9.64)#36 | 16.9%(-14.6)#1,112 |
| 37. | Garrett Park | 2.3% | 12.0%(-9.62)#37 | 16.9%(-14.6)#1,127 |
| 38. | North Beach | 2.4% | 12.0%(-9.56)#38 | 16.9%(-14.5)#1,168 |
| 39. | Chesapeake Beach | 2.4% | 12.0%(-9.53)#39 | 16.9%(-14.5)#1,187 |
| 40. | Sykesville | 2.4% | 12.0%(-9.52)#40 | 16.9%(-14.5)#1,196 |
| 41. | Centreville | 2.5% | 12.0%(-9.49)#41 | 16.9%(-14.5)#1,218 |
| 42. | Ashton Sandy Spring | 2.5% | 12.0%(-9.42)#42 | 16.9%(-14.4)#1,269 |
| 43. | Rosemont | 2.6% | 12.0%(-9.33)#43 | 16.9%(-14.3)#1,355 |
| 44. | Lutherville | 2.7% | 12.0%(-9.27)#44 | 16.9%(-14.2)#1,397 |
| 45. | Chestertown | 2.8% | 12.0%(-9.20)#45 | 16.9%(-14.2)#1,450 |
| 46. | Poolesville | 2.9% | 12.0%(-9.11)#46 | 16.9%(-14.1)#1,499 |
| 47. | Silver Hill | 2.9% | 12.0%(-9.11)#47 | 16.9%(-14.1)#1,500 |
| 48. | Hampton | 2.9% | 12.0%(-9.10)#48 | 16.9%(-14.1)#1,514 |
| 49. | Camp Springs | 2.9% | 12.0%(-9.07)#49 | 16.9%(-14.0)#1,548 |
| 50. | Bethesda | 2.9% | 12.0%(-9.04)#50 | 16.9%(-14.0)#1,557 |
| 51. | North Laurel | 2.9% | 12.0%(-9.03)#51 | 16.9%(-14.0)#1,565 |
| 52. | Potomac | 2.9% | 12.0%(-9.02)#52 | 16.9%(-14.0)#1,572 |
| 53. | Capitol Heights | 3.1% | 12.0%(-8.90)#53 | 16.9%(-13.9)#1,654 |
| 54. | Timonium | 3.1% | 12.0%(-8.85)#54 | 16.9%(-13.8)#1,687 |
| 55. | Olney | 3.1% | 12.0%(-8.85)#55 | 16.9%(-13.8)#1,689 |
| 56. | Barclay | 3.1% | 12.0%(-8.84)#56 | 16.9%(-13.8)#1,702 |
| 57. | Four Corners | 3.1% | 12.0%(-8.83)#57 | 16.9%(-13.8)#1,709 |
| 58. | Landover Hills | 3.1% | 12.0%(-8.83)#58 | 16.9%(-13.8)#1,711 |
| 59. | Pleasant Hills | 3.2% | 12.0%(-8.76)#59 | 16.9%(-13.7)#1,757 |
| 60. | Odenton | 3.3% | 12.0%(-8.69)#60 | 16.9%(-13.7)#1,795 |
| 61. | Cloverly | 3.3% | 12.0%(-8.65)#61 | 16.9%(-13.6)#1,827 |
| 62. | Mount Airy | 3.4% | 12.0%(-8.53)#62 | 16.9%(-13.5)#1,904 |
| 63. | Eldersburg | 3.5% | 12.0%(-8.46)#63 | 16.9%(-13.4)#1,971 |
| 64. | Arnold | 3.5% | 12.0%(-8.42)#64 | 16.9%(-13.4)#1,988 |
| 65. | South Kensington | 3.7% | 12.0%(-8.26)#65 | 16.9%(-13.2)#2,092 |
| 66. | Cape St Claire | 3.7% | 12.0%(-8.25)#66 | 16.9%(-13.2)#2,103 |
| 67. | Cedar Heights | 3.7% | 12.0%(-8.24)#67 | 16.9%(-13.2)#2,106 |
| 68. | St Michaels | 3.9% | 12.0%(-8.09)#68 | 16.9%(-13.1)#2,197 |
| 69. | Brock Hall | 3.9% | 12.0%(-8.08)#69 | 16.9%(-13.0)#2,200 |
| 70. | Bel Air South | 3.9% | 12.0%(-8.02)#70 | 16.9%(-13.0)#2,245 |
| 71. | Fairwood | 4.1% | 12.0%(-7.90)#71 | 16.9%(-12.9)#2,332 |
| 72. | Colmar Manor | 4.1% | 12.0%(-7.83)#72 | 16.9%(-12.8)#2,380 |
| 73. | Honeygo | 4.2% | 12.0%(-7.79)#73 | 16.9%(-12.8)#2,413 |
| 74. | Ocean Pines | 4.2% | 12.0%(-7.72)#74 | 16.9%(-12.7)#2,452 |
| 75. | Fruitland | 4.3% | 12.0%(-7.65)#75 | 16.9%(-12.6)#2,493 |
| 76. | Accokeek | 4.3% | 12.0%(-7.64)#76 | 16.9%(-12.6)#2,498 |
| 77. | Woodlawn Cdp Prince George S County | 4.5% | 12.0%(-7.51)#77 | 16.9%(-12.5)#2,603 |
| 78. | North Bethesda | 4.7% | 12.0%(-7.31)#78 | 16.9%(-12.3)#2,744 |
| 79. | Ilchester | 4.7% | 12.0%(-7.30)#79 | 16.9%(-12.3)#2,748 |
| 80. | Ellicott City | 4.8% | 12.0%(-7.12)#80 | 16.9%(-12.1)#2,855 |
| 81. | Huntingtown | 4.9% | 12.0%(-7.11)#81 | 16.9%(-12.1)#2,861 |
| 82. | Bowie | 4.9% | 12.0%(-7.02)#82 | 16.9%(-12.0)#2,935 |
| 83. | Peppermill Village | 5.0% | 12.0%(-6.98)#83 | 16.9%(-12.0)#2,960 |
| 84. | Henderson | 5.0% | 12.0%(-6.97)#84 | 16.9%(-11.9)#2,983 |
| 85. | Galena | 5.1% | 12.0%(-6.88)#85 | 16.9%(-11.9)#3,028 |
| 86. | Deale | 5.1% | 12.0%(-6.84)#86 | 16.9%(-11.8)#3,062 |
| 87. | Cheverly | 5.2% | 12.0%(-6.79)#87 | 16.9%(-11.8)#3,096 |
| 88. | North Potomac | 5.2% | 12.0%(-6.79)#88 | 16.9%(-11.8)#3,102 |
| 89. | Glen Echo | 5.3% | 12.0%(-6.70)#89 | 16.9%(-11.7)#3,158 |
| 90. | Morningside | 5.3% | 12.0%(-6.67)#90 | 16.9%(-11.6)#3,178 |
| 91. | Gambrills | 5.4% | 12.0%(-6.60)#91 | 16.9%(-11.6)#3,219 |
| 92. | Towson | 5.4% | 12.0%(-6.60)#92 | 16.9%(-11.6)#3,225 |
| 93. | Springdale | 5.5% | 12.0%(-6.49)#93 | 16.9%(-11.5)#3,288 |
| 94. | Rising Sun | 5.5% | 12.0%(-6.45)#94 | 16.9%(-11.4)#3,314 |
| 95. | Pikesville | 5.5% | 12.0%(-6.45)#95 | 16.9%(-11.4)#3,315 |
| 96. | Brunswick | 5.5% | 12.0%(-6.43)#96 | 16.9%(-11.4)#3,331 |
| 97. | Edgemere | 5.7% | 12.0%(-6.31)#97 | 16.9%(-11.3)#3,434 |
| 98. | Millington | 5.7% | 12.0%(-6.25)#98 | 16.9%(-11.2)#3,469 |
| 99. | Overlea | 5.7% | 12.0%(-6.22)#99 | 16.9%(-11.2)#3,497 |
| 100. | Brandywine | 5.8% | 12.0%(-6.13)#100 | 16.9%(-11.1)#3,564 |
Common Questions
What are the Top 10 Cities with the Lowest Poverty Level Among Children Under the Age of 16 in Maryland?
Top 10 Cities with the Lowest Poverty Level Among Children Under the Age of 16 in Maryland are:
#1
0.46%
#2
0.57%
#3
0.58%
#4
0.68%
#5
0.70%
#6
0.90%
#7
0.94%
#8
0.99%
#9
1.00%
#10
1.2%
What city has the Lowest Poverty Level Among Children Under the Age of 16 in Maryland?
Bryans Road has the Lowest Poverty Level Among Children Under the Age of 16 in Maryland with 0.46%.
What is the Poverty Level Among Children Under the Age of 16 in the State of Maryland?
Poverty Level Among Children Under the Age of 16 in Maryland is 12.0%.
What is the Poverty Level Among Children Under the Age of 16 in the United States?
Poverty Level Among Children Under the Age of 16 in the United States is 16.9%.