Cities with the Lowest Poverty Level Among Children Under the Age of 16 in Virginia
RELATED REPORTS & OPTIONS
Lowest Poverty | Child 0-16
Virginia
Compare Cities
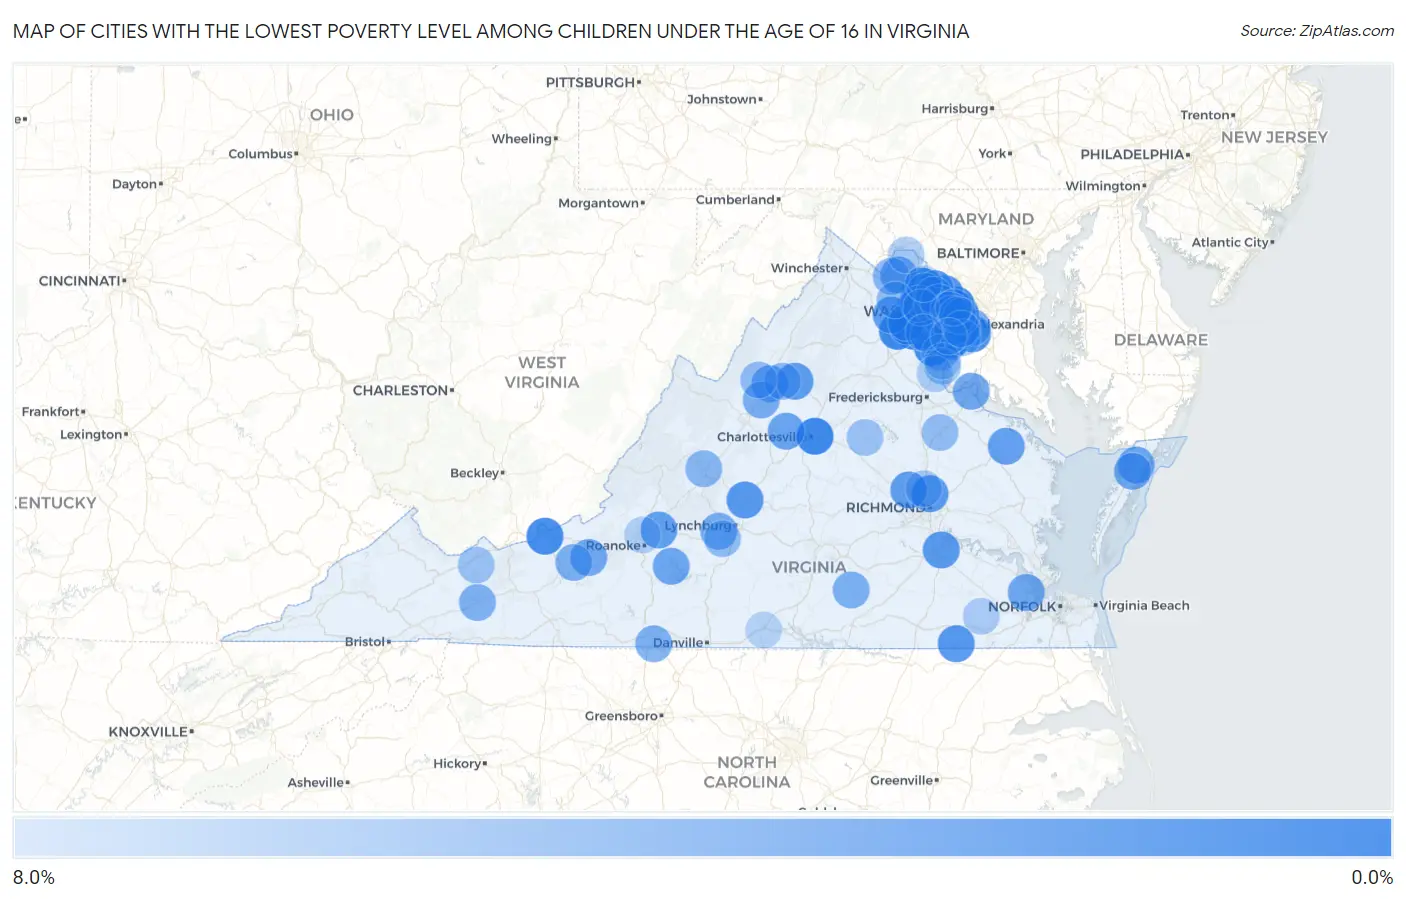
Map of Cities with the Lowest Poverty Level Among Children Under the Age of 16 in Virginia
8.0%
0.0%
Cities with the Lowest Poverty Level Among Children Under the Age of 16 in Virginia
| City | Child Poverty | vs State | vs National | |
| 1. | Belmont | 0.039% | 12.9%(-12.9)#1 | 16.9%(-16.9)#1 |
| 2. | Linton Hall | 0.25% | 12.9%(-12.7)#2 | 16.9%(-16.7)#17 |
| 3. | Brambleton | 0.35% | 12.9%(-12.6)#3 | 16.9%(-16.6)#33 |
| 4. | Pantops | 0.37% | 12.9%(-12.6)#4 | 16.9%(-16.6)#37 |
| 5. | Falls Church | 0.37% | 12.9%(-12.6)#5 | 16.9%(-16.6)#38 |
| 6. | New Baltimore | 0.43% | 12.9%(-12.5)#6 | 16.9%(-16.5)#45 |
| 7. | Fairfax Station | 0.53% | 12.9%(-12.4)#7 | 16.9%(-16.4)#71 |
| 8. | Independent Hill | 0.60% | 12.9%(-12.3)#8 | 16.9%(-16.3)#98 |
| 9. | Wolf Trap | 0.62% | 12.9%(-12.3)#9 | 16.9%(-16.3)#107 |
| 10. | Narrows | 0.66% | 12.9%(-12.3)#10 | 16.9%(-16.3)#119 |
| 11. | Hayfield | 0.69% | 12.9%(-12.2)#11 | 16.9%(-16.2)#129 |
| 12. | Rose Hill Cdp Fairfax County | 0.71% | 12.9%(-12.2)#12 | 16.9%(-16.2)#137 |
| 13. | Pimmit Hills | 0.74% | 12.9%(-12.2)#13 | 16.9%(-16.2)#152 |
| 14. | Laurel Hill | 0.80% | 12.9%(-12.1)#14 | 16.9%(-16.1)#171 |
| 15. | Broadlands | 0.87% | 12.9%(-12.1)#15 | 16.9%(-16.1)#222 |
| 16. | Stone Ridge | 0.87% | 12.9%(-12.1)#16 | 16.9%(-16.1)#223 |
| 17. | Mclean | 0.92% | 12.9%(-12.0)#17 | 16.9%(-16.0)#247 |
| 18. | Fort Hunt | 0.98% | 12.9%(-12.0)#18 | 16.9%(-16.0)#269 |
| 19. | Great Falls | 1.0% | 12.9%(-11.9)#19 | 16.9%(-15.9)#292 |
| 20. | Dranesville | 1.1% | 12.9%(-11.8)#20 | 16.9%(-15.8)#345 |
| 21. | Burke | 1.2% | 12.9%(-11.7)#21 | 16.9%(-15.7)#400 |
| 22. | Newington | 1.3% | 12.9%(-11.7)#22 | 16.9%(-15.7)#423 |
| 23. | Cascades | 1.3% | 12.9%(-11.6)#23 | 16.9%(-15.6)#444 |
| 24. | Boykins | 1.5% | 12.9%(-11.5)#24 | 16.9%(-15.5)#536 |
| 25. | Amherst | 1.6% | 12.9%(-11.4)#25 | 16.9%(-15.4)#605 |
| 26. | Burke Centre | 1.6% | 12.9%(-11.3)#26 | 16.9%(-15.3)#625 |
| 27. | Chamberlayne | 1.7% | 12.9%(-11.3)#27 | 16.9%(-15.3)#666 |
| 28. | Fort Lee | 1.7% | 12.9%(-11.2)#28 | 16.9%(-15.2)#705 |
| 29. | Gainesville | 1.8% | 12.9%(-11.2)#29 | 16.9%(-15.2)#735 |
| 30. | Long Branch | 1.8% | 12.9%(-11.1)#30 | 16.9%(-15.1)#794 |
| 31. | Elkton | 1.9% | 12.9%(-11.0)#31 | 16.9%(-15.0)#868 |
| 32. | Short Pump | 2.0% | 12.9%(-11.0)#32 | 16.9%(-15.0)#894 |
| 33. | Blue Ridge | 2.1% | 12.9%(-10.9)#33 | 16.9%(-14.9)#952 |
| 34. | The Plains | 2.1% | 12.9%(-10.8)#34 | 16.9%(-14.9)#962 |
| 35. | Haymarket | 2.2% | 12.9%(-10.7)#35 | 16.9%(-14.8)#1,030 |
| 36. | Warsaw | 2.2% | 12.9%(-10.7)#36 | 16.9%(-14.7)#1,050 |
| 37. | Loudoun Valley Estates | 2.4% | 12.9%(-10.5)#37 | 16.9%(-14.6)#1,154 |
| 38. | Franklin Farm | 2.4% | 12.9%(-10.5)#38 | 16.9%(-14.5)#1,189 |
| 39. | Occoquan | 2.5% | 12.9%(-10.4)#39 | 16.9%(-14.4)#1,226 |
| 40. | Crozet | 2.5% | 12.9%(-10.4)#40 | 16.9%(-14.4)#1,238 |
| 41. | Bloxom | 2.6% | 12.9%(-10.3)#41 | 16.9%(-14.4)#1,316 |
| 42. | Westlake Corner | 2.6% | 12.9%(-10.3)#42 | 16.9%(-14.3)#1,347 |
| 43. | Benns Church | 2.7% | 12.9%(-10.2)#43 | 16.9%(-14.2)#1,413 |
| 44. | Parksley | 2.7% | 12.9%(-10.2)#44 | 16.9%(-14.2)#1,415 |
| 45. | Purcellville | 2.7% | 12.9%(-10.2)#45 | 16.9%(-14.2)#1,431 |
| 46. | Dahlgren | 2.7% | 12.9%(-10.2)#46 | 16.9%(-14.2)#1,438 |
| 47. | Merrimac | 2.9% | 12.9%(-10.1)#47 | 16.9%(-14.1)#1,519 |
| 48. | Midlothian | 3.0% | 12.9%(-9.96)#48 | 16.9%(-14.0)#1,584 |
| 49. | Massanetta Springs | 3.0% | 12.9%(-9.92)#49 | 16.9%(-13.9)#1,613 |
| 50. | Forest | 3.2% | 12.9%(-9.77)#50 | 16.9%(-13.8)#1,726 |
| 51. | Weyers Cave | 3.2% | 12.9%(-9.74)#51 | 16.9%(-13.8)#1,740 |
| 52. | Fair Oaks | 3.3% | 12.9%(-9.65)#52 | 16.9%(-13.7)#1,793 |
| 53. | Belle Haven | 3.4% | 12.9%(-9.55)#53 | 16.9%(-13.6)#1,874 |
| 54. | Kings Park West | 3.4% | 12.9%(-9.53)#54 | 16.9%(-13.5)#1,884 |
| 55. | Kenbridge | 3.4% | 12.9%(-9.53)#55 | 16.9%(-13.5)#1,886 |
| 56. | Ridgeway | 3.4% | 12.9%(-9.51)#56 | 16.9%(-13.5)#1,897 |
| 57. | Ashburn | 3.4% | 12.9%(-9.49)#57 | 16.9%(-13.5)#1,912 |
| 58. | Newington Forest | 3.5% | 12.9%(-9.47)#58 | 16.9%(-13.5)#1,935 |
| 59. | Fairlawn | 3.5% | 12.9%(-9.43)#59 | 16.9%(-13.4)#1,968 |
| 60. | Atkins | 3.6% | 12.9%(-9.33)#60 | 16.9%(-13.3)#2,011 |
| 61. | Dunn Loring | 3.6% | 12.9%(-9.32)#61 | 16.9%(-13.3)#2,023 |
| 62. | Oakton | 3.6% | 12.9%(-9.31)#62 | 16.9%(-13.3)#2,027 |
| 63. | Floris | 3.6% | 12.9%(-9.30)#63 | 16.9%(-13.3)#2,040 |
| 64. | Buckhall | 3.8% | 12.9%(-9.15)#64 | 16.9%(-13.2)#2,139 |
| 65. | Kingstowne | 3.9% | 12.9%(-9.08)#65 | 16.9%(-13.1)#2,185 |
| 66. | East Lexington | 4.0% | 12.9%(-8.94)#66 | 16.9%(-12.9)#2,273 |
| 67. | Arcola | 4.0% | 12.9%(-8.94)#67 | 16.9%(-12.9)#2,274 |
| 68. | Round Hill | 4.0% | 12.9%(-8.93)#68 | 16.9%(-12.9)#2,279 |
| 69. | West Springfield | 4.2% | 12.9%(-8.73)#69 | 16.9%(-12.7)#2,424 |
| 70. | Massanutten | 4.3% | 12.9%(-8.67)#70 | 16.9%(-12.7)#2,462 |
| 71. | Dayton | 4.3% | 12.9%(-8.59)#71 | 16.9%(-12.6)#2,507 |
| 72. | Middleburg | 4.4% | 12.9%(-8.49)#72 | 16.9%(-12.5)#2,591 |
| 73. | Timberlake | 4.5% | 12.9%(-8.48)#73 | 16.9%(-12.5)#2,600 |
| 74. | Bowling Green | 4.5% | 12.9%(-8.48)#74 | 16.9%(-12.5)#2,601 |
| 75. | Sterling | 4.5% | 12.9%(-8.42)#75 | 16.9%(-12.4)#2,641 |
| 76. | Reston | 4.7% | 12.9%(-8.28)#76 | 16.9%(-12.3)#2,742 |
| 77. | Vienna | 4.7% | 12.9%(-8.21)#77 | 16.9%(-12.2)#2,781 |
| 78. | Montclair | 4.7% | 12.9%(-8.19)#78 | 16.9%(-12.2)#2,790 |
| 79. | Quantico Base | 4.8% | 12.9%(-8.13)#79 | 16.9%(-12.1)#2,828 |
| 80. | Merrifield | 4.8% | 12.9%(-8.08)#80 | 16.9%(-12.1)#2,858 |
| 81. | Louisa | 4.9% | 12.9%(-8.04)#81 | 16.9%(-12.0)#2,892 |
| 82. | Lake Barcroft | 4.9% | 12.9%(-8.02)#82 | 16.9%(-12.0)#2,909 |
| 83. | Gratton | 5.0% | 12.9%(-7.98)#83 | 16.9%(-12.0)#2,941 |
| 84. | West Falls Church | 5.1% | 12.9%(-7.86)#84 | 16.9%(-11.9)#3,019 |
| 85. | Glen Allen | 5.2% | 12.9%(-7.72)#85 | 16.9%(-11.7)#3,123 |
| 86. | Fort Belvoir | 5.5% | 12.9%(-7.47)#86 | 16.9%(-11.5)#3,280 |
| 87. | Lovettsville | 5.5% | 12.9%(-7.40)#87 | 16.9%(-11.4)#3,328 |
| 88. | Sedley | 5.6% | 12.9%(-7.34)#88 | 16.9%(-11.3)#3,390 |
| 89. | South Riding | 5.6% | 12.9%(-7.29)#89 | 16.9%(-11.3)#3,420 |
| 90. | Aquia Harbour | 5.7% | 12.9%(-7.20)#90 | 16.9%(-11.2)#3,488 |
| 91. | Franconia | 5.7% | 12.9%(-7.20)#91 | 16.9%(-11.2)#3,489 |
| 92. | Manassas | 5.8% | 12.9%(-7.13)#92 | 16.9%(-11.1)#3,543 |
| 93. | Tysons | 5.8% | 12.9%(-7.11)#93 | 16.9%(-11.1)#3,552 |
| 94. | Leesylvania | 5.9% | 12.9%(-7.00)#94 | 16.9%(-11.0)#3,633 |
| 95. | Hollins | 6.0% | 12.9%(-6.94)#95 | 16.9%(-11.0)#3,682 |
| 96. | Sully Square | 6.0% | 12.9%(-6.89)#96 | 16.9%(-10.9)#3,729 |
| 97. | Triangle | 6.2% | 12.9%(-6.76)#97 | 16.9%(-10.8)#3,815 |
| 98. | Riverdale | 6.2% | 12.9%(-6.75)#98 | 16.9%(-10.8)#3,824 |
| 99. | Lansdowne | 6.2% | 12.9%(-6.73)#99 | 16.9%(-10.7)#3,844 |
| 100. | Crosspointe | 6.2% | 12.9%(-6.68)#100 | 16.9%(-10.7)#3,862 |
Common Questions
What are the Top 10 Cities with the Lowest Poverty Level Among Children Under the Age of 16 in Virginia?
Top 10 Cities with the Lowest Poverty Level Among Children Under the Age of 16 in Virginia are:
#1
0.039%
#2
0.25%
#3
0.35%
#4
0.37%
#5
0.37%
#6
0.43%
#7
0.53%
#8
0.60%
#9
0.62%
#10
0.66%
What city has the Lowest Poverty Level Among Children Under the Age of 16 in Virginia?
Belmont has the Lowest Poverty Level Among Children Under the Age of 16 in Virginia with 0.039%.
What is the Poverty Level Among Children Under the Age of 16 in the State of Virginia?
Poverty Level Among Children Under the Age of 16 in Virginia is 12.9%.
What is the Poverty Level Among Children Under the Age of 16 in the United States?
Poverty Level Among Children Under the Age of 16 in the United States is 16.9%.