Cities with the Lowest Poverty Level Among Children Under the Age of 16 in Ohio
RELATED REPORTS & OPTIONS
Lowest Poverty | Child 0-16
Ohio
Compare Cities
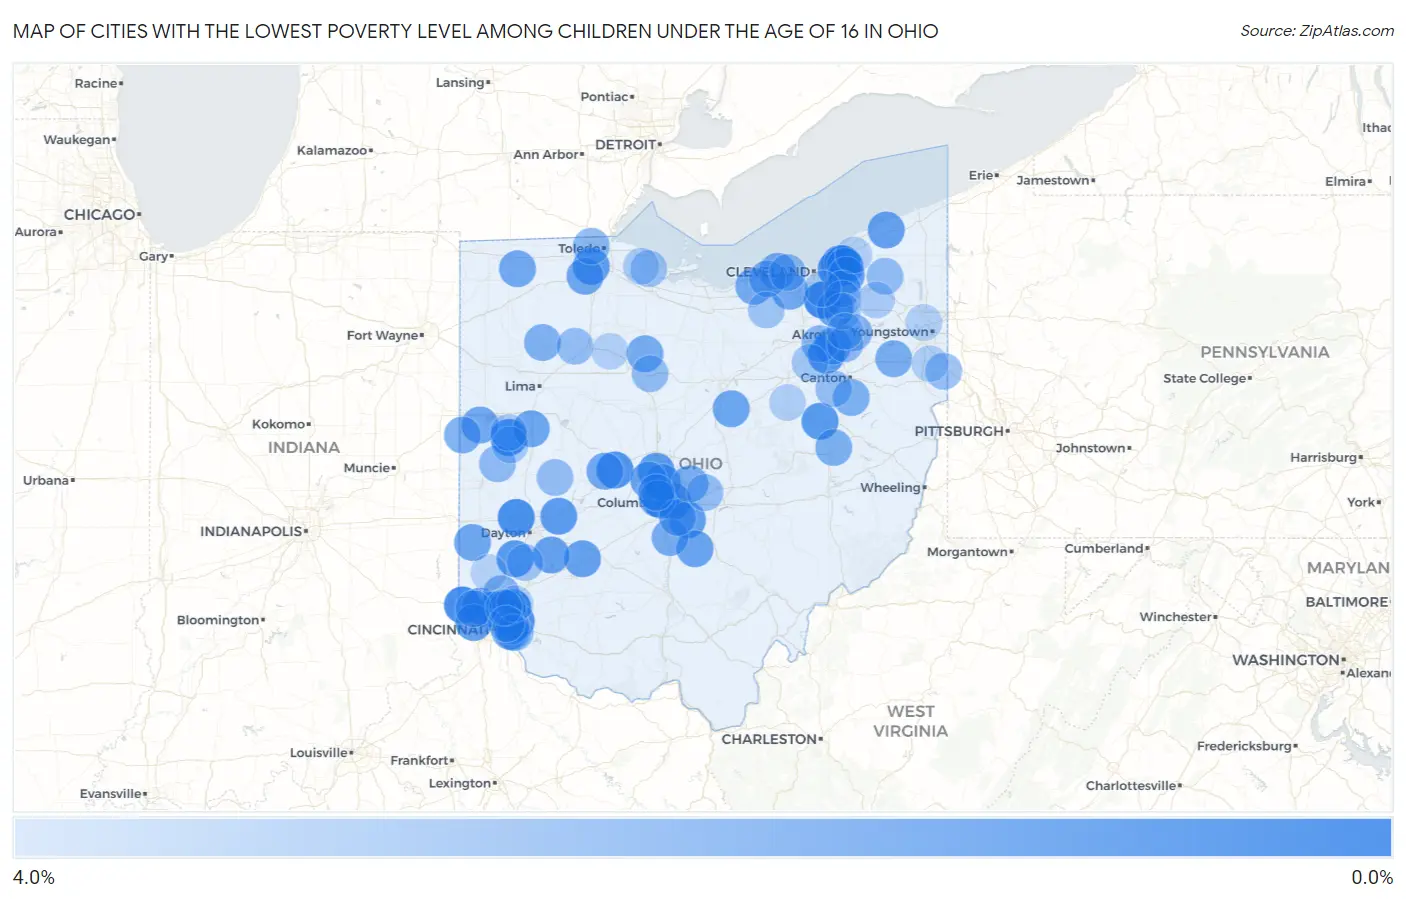
Map of Cities with the Lowest Poverty Level Among Children Under the Age of 16 in Ohio
4.0%
0.0%
Cities with the Lowest Poverty Level Among Children Under the Age of 16 in Ohio
| City | Child Poverty | vs State | vs National | |
| 1. | Highland Heights | 0.12% | 18.8%(-18.6)#1 | 16.9%(-16.8)#4 |
| 2. | Brecksville | 0.31% | 18.8%(-18.4)#2 | 16.9%(-16.6)#24 |
| 3. | Montgomery | 0.33% | 18.8%(-18.4)#3 | 16.9%(-16.6)#30 |
| 4. | Woodsdale | 0.42% | 18.8%(-18.3)#4 | 16.9%(-16.5)#43 |
| 5. | Wyoming | 0.52% | 18.8%(-18.2)#5 | 16.9%(-16.4)#67 |
| 6. | Harrison | 0.57% | 18.8%(-18.2)#6 | 16.9%(-16.4)#85 |
| 7. | Englewood | 0.65% | 18.8%(-18.1)#7 | 16.9%(-16.3)#117 |
| 8. | Lyndhurst | 0.75% | 18.8%(-18.0)#8 | 16.9%(-16.2)#153 |
| 9. | Minster | 0.76% | 18.8%(-18.0)#9 | 16.9%(-16.2)#161 |
| 10. | Terrace Park | 0.81% | 18.8%(-17.9)#10 | 16.9%(-16.1)#174 |
| 11. | Madeira | 0.85% | 18.8%(-17.9)#11 | 16.9%(-16.1)#207 |
| 12. | Milford Center | 0.85% | 18.8%(-17.9)#12 | 16.9%(-16.1)#208 |
| 13. | Grandview Heights | 0.87% | 18.8%(-17.9)#13 | 16.9%(-16.1)#218 |
| 14. | New Franklin | 1.0% | 18.8%(-17.7)#14 | 16.9%(-15.9)#301 |
| 15. | Carlisle | 1.1% | 18.8%(-17.6)#15 | 16.9%(-15.8)#341 |
| 16. | Sugarcreek | 1.1% | 18.8%(-17.6)#16 | 16.9%(-15.8)#356 |
| 17. | Enon | 1.1% | 18.8%(-17.6)#17 | 16.9%(-15.8)#361 |
| 18. | Bexley | 1.2% | 18.8%(-17.6)#18 | 16.9%(-15.8)#378 |
| 19. | Powell | 1.2% | 18.8%(-17.6)#19 | 16.9%(-15.7)#388 |
| 20. | Dry Ridge | 1.2% | 18.8%(-17.5)#20 | 16.9%(-15.7)#394 |
| 21. | Mayfield | 1.2% | 18.8%(-17.5)#21 | 16.9%(-15.7)#408 |
| 22. | Mack | 1.3% | 18.8%(-17.5)#22 | 16.9%(-15.7)#437 |
| 23. | Perrysburg | 1.3% | 18.8%(-17.4)#23 | 16.9%(-15.6)#449 |
| 24. | Gates Mills | 1.4% | 18.8%(-17.4)#24 | 16.9%(-15.6)#483 |
| 25. | Canal Winchester | 1.4% | 18.8%(-17.4)#25 | 16.9%(-15.6)#487 |
| 26. | Wilkshire Hills | 1.4% | 18.8%(-17.4)#26 | 16.9%(-15.6)#489 |
| 27. | Hunting Valley | 1.4% | 18.8%(-17.4)#27 | 16.9%(-15.6)#494 |
| 28. | Madison | 1.4% | 18.8%(-17.4)#28 | 16.9%(-15.5)#499 |
| 29. | Kenwood | 1.5% | 18.8%(-17.3)#29 | 16.9%(-15.5)#535 |
| 30. | Bowersville | 1.5% | 18.8%(-17.3)#30 | 16.9%(-15.5)#543 |
| 31. | Boston Heights | 1.5% | 18.8%(-17.3)#31 | 16.9%(-15.5)#546 |
| 32. | Spring Valley | 1.5% | 18.8%(-17.2)#32 | 16.9%(-15.4)#564 |
| 33. | Amanda | 1.6% | 18.8%(-17.2)#33 | 16.9%(-15.4)#604 |
| 34. | Worthington | 1.6% | 18.8%(-17.2)#34 | 16.9%(-15.3)#620 |
| 35. | Sherwood | 1.6% | 18.8%(-17.1)#35 | 16.9%(-15.3)#626 |
| 36. | Portage Lakes | 1.6% | 18.8%(-17.1)#36 | 16.9%(-15.3)#633 |
| 37. | Dublin | 1.6% | 18.8%(-17.1)#37 | 16.9%(-15.3)#637 |
| 38. | Butler | 1.7% | 18.8%(-17.1)#38 | 16.9%(-15.3)#665 |
| 39. | Botkins | 1.7% | 18.8%(-17.1)#39 | 16.9%(-15.3)#675 |
| 40. | Haskins | 1.7% | 18.8%(-17.0)#40 | 16.9%(-15.2)#702 |
| 41. | Lake Lakengren | 1.7% | 18.8%(-17.0)#41 | 16.9%(-15.2)#715 |
| 42. | Olmsted Falls | 1.8% | 18.8%(-17.0)#42 | 16.9%(-15.2)#737 |
| 43. | Archbold | 1.8% | 18.8%(-16.9)#43 | 16.9%(-15.1)#771 |
| 44. | Coldwater | 1.8% | 18.8%(-16.9)#44 | 16.9%(-15.1)#775 |
| 45. | Woodstock | 1.8% | 18.8%(-16.9)#45 | 16.9%(-15.1)#781 |
| 46. | Avon Lake | 1.8% | 18.8%(-16.9)#46 | 16.9%(-15.1)#786 |
| 47. | Marble Cliff | 1.9% | 18.8%(-16.9)#47 | 16.9%(-15.1)#807 |
| 48. | Amherst | 1.9% | 18.8%(-16.8)#48 | 16.9%(-15.0)#848 |
| 49. | Ashville | 2.0% | 18.8%(-16.8)#49 | 16.9%(-14.9)#910 |
| 50. | Sycamore | 2.0% | 18.8%(-16.8)#50 | 16.9%(-14.9)#911 |
| 51. | Groveport | 2.0% | 18.8%(-16.7)#51 | 16.9%(-14.9)#919 |
| 52. | New Albany | 2.0% | 18.8%(-16.7)#52 | 16.9%(-14.9)#934 |
| 53. | Fort Recovery | 2.1% | 18.8%(-16.7)#53 | 16.9%(-14.9)#953 |
| 54. | Beloit | 2.1% | 18.8%(-16.7)#54 | 16.9%(-14.9)#955 |
| 55. | Port Washington | 2.2% | 18.8%(-16.6)#55 | 16.9%(-14.8)#1,019 |
| 56. | East Sparta | 2.2% | 18.8%(-16.6)#56 | 16.9%(-14.8)#1,026 |
| 57. | Glandorf | 2.2% | 18.8%(-16.5)#57 | 16.9%(-14.7)#1,073 |
| 58. | Sheffield | 2.3% | 18.8%(-16.5)#58 | 16.9%(-14.6)#1,098 |
| 59. | Beckett Ridge | 2.4% | 18.8%(-16.4)#59 | 16.9%(-14.5)#1,158 |
| 60. | Brimfield | 2.4% | 18.8%(-16.3)#60 | 16.9%(-14.5)#1,171 |
| 61. | Solon | 2.4% | 18.8%(-16.3)#61 | 16.9%(-14.5)#1,194 |
| 62. | Norton | 2.5% | 18.8%(-16.3)#62 | 16.9%(-14.5)#1,199 |
| 63. | Cherry Grove | 2.6% | 18.8%(-16.2)#63 | 16.9%(-14.4)#1,279 |
| 64. | Newtown | 2.6% | 18.8%(-16.2)#64 | 16.9%(-14.4)#1,281 |
| 65. | Upper Arlington | 2.6% | 18.8%(-16.2)#65 | 16.9%(-14.3)#1,326 |
| 66. | Ottawa Hills | 2.6% | 18.8%(-16.1)#66 | 16.9%(-14.3)#1,331 |
| 67. | Versailles | 2.7% | 18.8%(-16.1)#67 | 16.9%(-14.3)#1,379 |
| 68. | Lakemore | 2.7% | 18.8%(-16.1)#68 | 16.9%(-14.3)#1,380 |
| 69. | Taylor Creek | 2.7% | 18.8%(-16.1)#69 | 16.9%(-14.3)#1,382 |
| 70. | Bay Village | 2.7% | 18.8%(-16.0)#70 | 16.9%(-14.2)#1,424 |
| 71. | Middlefield | 2.8% | 18.8%(-16.0)#71 | 16.9%(-14.2)#1,454 |
| 72. | Nevada | 2.8% | 18.8%(-16.0)#72 | 16.9%(-14.2)#1,457 |
| 73. | St Paris | 2.8% | 18.8%(-15.9)#73 | 16.9%(-14.1)#1,492 |
| 74. | Beechwood Trails | 2.9% | 18.8%(-15.9)#74 | 16.9%(-14.1)#1,498 |
| 75. | Benton Ridge | 2.9% | 18.8%(-15.9)#75 | 16.9%(-14.1)#1,508 |
| 76. | East Palestine | 2.9% | 18.8%(-15.9)#76 | 16.9%(-14.1)#1,520 |
| 77. | Navarre | 2.9% | 18.8%(-15.9)#77 | 16.9%(-14.1)#1,524 |
| 78. | Oak Harbor | 3.0% | 18.8%(-15.7)#78 | 16.9%(-13.9)#1,619 |
| 79. | Springboro | 3.1% | 18.8%(-15.7)#79 | 16.9%(-13.9)#1,660 |
| 80. | Lagrange | 3.1% | 18.8%(-15.6)#80 | 16.9%(-13.8)#1,684 |
| 81. | Twinsburg | 3.2% | 18.8%(-15.6)#81 | 16.9%(-13.8)#1,723 |
| 82. | Blue Ash | 3.2% | 18.8%(-15.6)#82 | 16.9%(-13.8)#1,732 |
| 83. | Marshallville | 3.2% | 18.8%(-15.5)#83 | 16.9%(-13.7)#1,754 |
| 84. | Hudson | 3.2% | 18.8%(-15.5)#84 | 16.9%(-13.7)#1,760 |
| 85. | Fort Loramie | 3.4% | 18.8%(-15.4)#85 | 16.9%(-13.6)#1,856 |
| 86. | New Bremen | 3.4% | 18.8%(-15.4)#86 | 16.9%(-13.6)#1,867 |
| 87. | Tallmadge | 3.4% | 18.8%(-15.3)#87 | 16.9%(-13.5)#1,901 |
| 88. | Rocky Ridge | 3.4% | 18.8%(-15.3)#88 | 16.9%(-13.5)#1,920 |
| 89. | Valley View | 3.5% | 18.8%(-15.3)#89 | 16.9%(-13.5)#1,942 |
| 90. | Hiram | 3.5% | 18.8%(-15.3)#90 | 16.9%(-13.5)#1,946 |
| 91. | Holmesville | 3.6% | 18.8%(-15.2)#91 | 16.9%(-13.4)#1,997 |
| 92. | Sixteen Mile Stand | 3.6% | 18.8%(-15.2)#92 | 16.9%(-13.3)#2,013 |
| 93. | Columbiana | 3.6% | 18.8%(-15.1)#93 | 16.9%(-13.3)#2,030 |
| 94. | Forestville | 3.7% | 18.8%(-15.1)#94 | 16.9%(-13.3)#2,058 |
| 95. | Evendale | 3.7% | 18.8%(-15.1)#95 | 16.9%(-13.3)#2,061 |
| 96. | Mcdonald | 3.7% | 18.8%(-15.1)#96 | 16.9%(-13.2)#2,079 |
| 97. | Vanlue | 3.7% | 18.8%(-15.0)#97 | 16.9%(-13.2)#2,086 |
| 98. | Kirtland | 3.7% | 18.8%(-15.0)#98 | 16.9%(-13.2)#2,110 |
| 99. | Seven Mile | 3.8% | 18.8%(-14.9)#99 | 16.9%(-13.1)#2,165 |
| 100. | Fairfax | 3.8% | 18.8%(-14.9)#100 | 16.9%(-13.1)#2,167 |
Common Questions
What are the Top 10 Cities with the Lowest Poverty Level Among Children Under the Age of 16 in Ohio?
Top 10 Cities with the Lowest Poverty Level Among Children Under the Age of 16 in Ohio are:
#1
0.12%
#2
0.31%
#3
0.33%
#4
0.52%
#5
0.57%
#6
0.65%
#7
0.75%
#8
0.76%
#9
0.81%
#10
0.85%
What city has the Lowest Poverty Level Among Children Under the Age of 16 in Ohio?
Highland Heights has the Lowest Poverty Level Among Children Under the Age of 16 in Ohio with 0.12%.
What is the Poverty Level Among Children Under the Age of 16 in the State of Ohio?
Poverty Level Among Children Under the Age of 16 in Ohio is 18.8%.
What is the Poverty Level Among Children Under the Age of 16 in the United States?
Poverty Level Among Children Under the Age of 16 in the United States is 16.9%.