Cities with the Lowest Poverty Level Among Children Under the Age of 16 in West Virginia
RELATED REPORTS & OPTIONS
Lowest Poverty | Child 0-16
West Virginia
Compare Cities
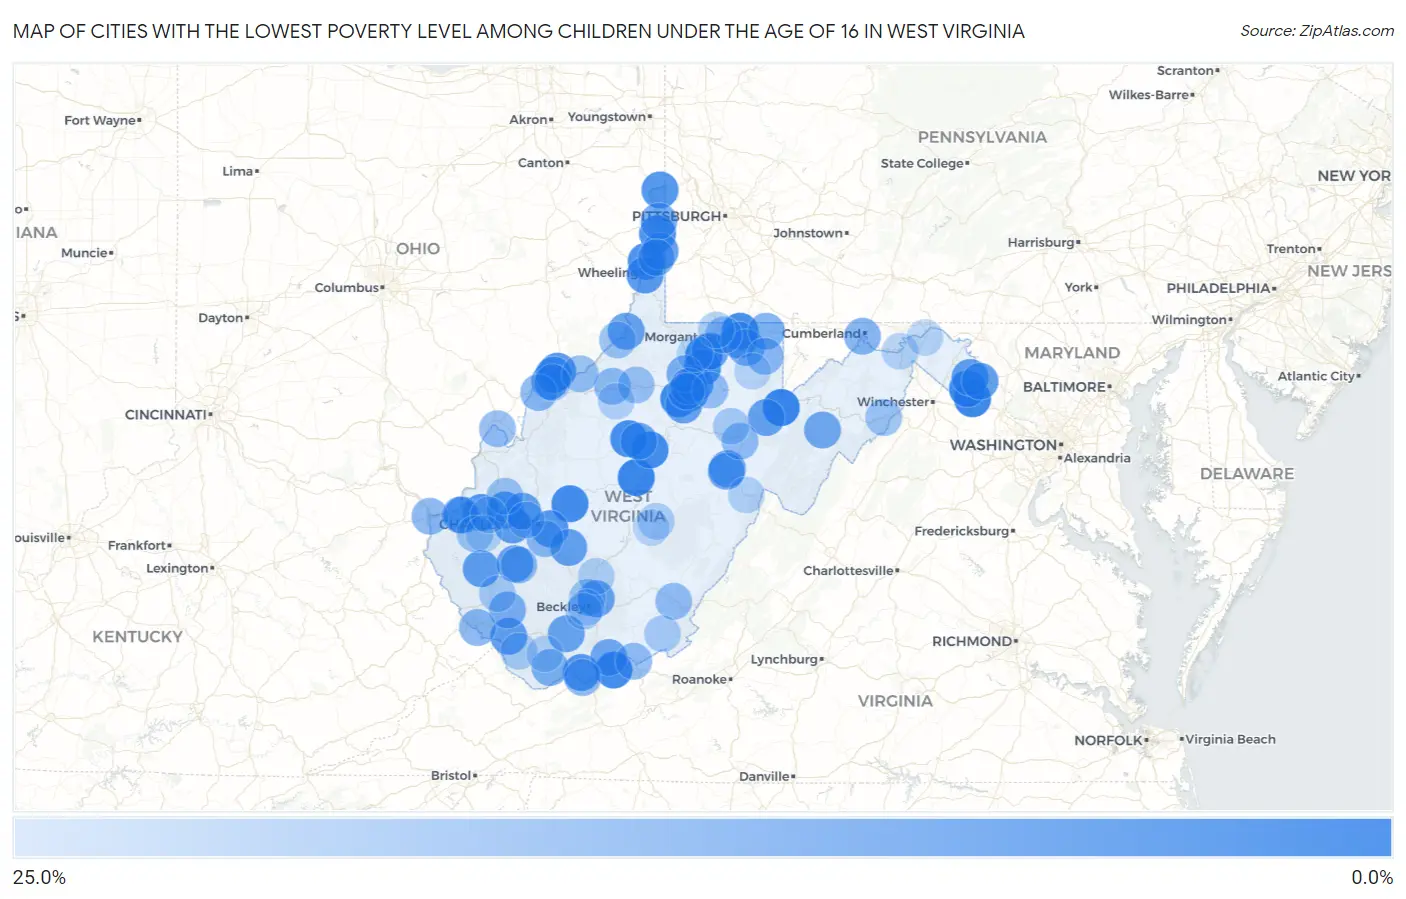
Map of Cities with the Lowest Poverty Level Among Children Under the Age of 16 in West Virginia
25.0%
0.0%
Cities with the Lowest Poverty Level Among Children Under the Age of 16 in West Virginia
| City | Child Poverty | vs State | vs National | |
| 1. | Thomas | 1.2% | 22.8%(-21.7)#1 | 16.9%(-15.8)#382 |
| 2. | Gassaway | 1.4% | 22.8%(-21.4)#2 | 16.9%(-15.5)#524 |
| 3. | Shannondale | 1.5% | 22.8%(-21.3)#3 | 16.9%(-15.4)#583 |
| 4. | West Milford | 2.4% | 22.8%(-20.5)#4 | 16.9%(-14.6)#1,149 |
| 5. | Oakvale | 2.6% | 22.8%(-20.3)#5 | 16.9%(-14.4)#1,289 |
| 6. | Charles Town | 2.6% | 22.8%(-20.2)#6 | 16.9%(-14.3)#1,359 |
| 7. | Barrackville | 2.8% | 22.8%(-20.1)#7 | 16.9%(-14.2)#1,443 |
| 8. | Cheat Lake | 2.8% | 22.8%(-20.0)#8 | 16.9%(-14.1)#1,496 |
| 9. | Burnsville | 2.9% | 22.8%(-20.0)#9 | 16.9%(-14.1)#1,526 |
| 10. | Clendenin | 3.0% | 22.8%(-19.8)#10 | 16.9%(-13.9)#1,593 |
| 11. | Stonewood | 3.0% | 22.8%(-19.8)#11 | 16.9%(-13.9)#1,598 |
| 12. | Glenville | 3.1% | 22.8%(-19.7)#12 | 16.9%(-13.8)#1,673 |
| 13. | White Hall | 3.3% | 22.8%(-19.5)#13 | 16.9%(-13.6)#1,806 |
| 14. | Clearview | 4.1% | 22.8%(-18.7)#14 | 16.9%(-12.8)#2,376 |
| 15. | Hooverson Heights | 4.3% | 22.8%(-18.5)#15 | 16.9%(-12.6)#2,479 |
| 16. | Chester | 5.1% | 22.8%(-17.7)#16 | 16.9%(-11.8)#3,079 |
| 17. | Coal Fork | 5.5% | 22.8%(-17.4)#17 | 16.9%(-11.5)#3,285 |
| 18. | Milton | 5.5% | 22.8%(-17.3)#18 | 16.9%(-11.4)#3,317 |
| 19. | Bluewell | 5.8% | 22.8%(-17.0)#19 | 16.9%(-11.1)#3,542 |
| 20. | Williamstown | 5.8% | 22.8%(-17.0)#20 | 16.9%(-11.1)#3,554 |
| 21. | Vienna | 6.0% | 22.8%(-16.9)#21 | 16.9%(-11.0)#3,661 |
| 22. | Teays Valley | 6.2% | 22.8%(-16.6)#22 | 16.9%(-10.7)#3,846 |
| 23. | Bethlehem | 6.3% | 22.8%(-16.5)#23 | 16.9%(-10.6)#3,915 |
| 24. | Barboursville | 6.3% | 22.8%(-16.5)#24 | 16.9%(-10.6)#3,932 |
| 25. | Harts | 6.7% | 22.8%(-16.1)#25 | 16.9%(-10.2)#4,176 |
| 26. | Tornado | 7.0% | 22.8%(-15.8)#26 | 16.9%(-9.91)#4,396 |
| 27. | Shenandoah Junction | 7.2% | 22.8%(-15.7)#27 | 16.9%(-9.76)#4,514 |
| 28. | Bolivar | 7.3% | 22.8%(-15.5)#28 | 16.9%(-9.62)#4,594 |
| 29. | Gilbert Creek | 7.4% | 22.8%(-15.4)#29 | 16.9%(-9.53)#4,652 |
| 30. | Boaz | 7.4% | 22.8%(-15.4)#30 | 16.9%(-9.49)#4,675 |
| 31. | Bethany | 7.6% | 22.8%(-15.3)#31 | 16.9%(-9.36)#4,761 |
| 32. | Handley | 7.8% | 22.8%(-15.1)#32 | 16.9%(-9.17)#4,889 |
| 33. | Cross Lanes | 8.0% | 22.8%(-14.9)#33 | 16.9%(-8.97)#5,016 |
| 34. | Lost Creek | 8.0% | 22.8%(-14.8)#34 | 16.9%(-8.94)#5,030 |
| 35. | Hendricks | 8.0% | 22.8%(-14.8)#35 | 16.9%(-8.94)#5,031 |
| 36. | Danville | 8.1% | 22.8%(-14.7)#36 | 16.9%(-8.83)#5,096 |
| 37. | Bridgeport | 8.2% | 22.8%(-14.6)#37 | 16.9%(-8.72)#5,163 |
| 38. | New Martinsville | 8.4% | 22.8%(-14.4)#38 | 16.9%(-8.52)#5,313 |
| 39. | Piney View | 8.5% | 22.8%(-14.4)#39 | 16.9%(-8.48)#5,336 |
| 40. | Rivesville | 8.5% | 22.8%(-14.4)#40 | 16.9%(-8.46)#5,344 |
| 41. | Brookhaven | 8.8% | 22.8%(-14.1)#41 | 16.9%(-8.16)#5,556 |
| 42. | Mill Creek | 8.8% | 22.8%(-14.1)#42 | 16.9%(-8.16)#5,557 |
| 43. | Mullens | 8.9% | 22.8%(-14.0)#43 | 16.9%(-8.07)#5,616 |
| 44. | Sand Fork | 9.3% | 22.8%(-13.5)#44 | 16.9%(-7.64)#5,930 |
| 45. | Athens | 9.9% | 22.8%(-13.0)#45 | 16.9%(-7.06)#6,272 |
| 46. | Petersburg | 9.9% | 22.8%(-12.9)#46 | 16.9%(-7.04)#6,297 |
| 47. | Weirton | 10.4% | 22.8%(-12.4)#47 | 16.9%(-6.55)#6,591 |
| 48. | Huttonsville | 10.5% | 22.8%(-12.3)#48 | 16.9%(-6.41)#6,674 |
| 49. | Lumberport | 11.3% | 22.8%(-11.5)#49 | 16.9%(-5.65)#7,166 |
| 50. | West Liberty | 11.4% | 22.8%(-11.5)#50 | 16.9%(-5.56)#7,222 |
| 51. | Man | 11.5% | 22.8%(-11.3)#51 | 16.9%(-5.40)#7,301 |
| 52. | Masontown | 11.6% | 22.8%(-11.2)#52 | 16.9%(-5.34)#7,346 |
| 53. | Gary | 11.9% | 22.8%(-10.9)#53 | 16.9%(-5.05)#7,521 |
| 54. | Brandonville | 12.2% | 22.8%(-10.7)#54 | 16.9%(-4.78)#7,689 |
| 55. | Carpendale | 12.5% | 22.8%(-10.3)#55 | 16.9%(-4.44)#7,880 |
| 56. | Despard | 12.6% | 22.8%(-10.2)#56 | 16.9%(-4.30)#7,962 |
| 57. | Blennerhassett | 13.4% | 22.8%(-9.42)#57 | 16.9%(-3.52)#8,384 |
| 58. | Matewan | 13.5% | 22.8%(-9.29)#58 | 16.9%(-3.40)#8,458 |
| 59. | Kenova | 13.7% | 22.8%(-9.18)#59 | 16.9%(-3.28)#8,522 |
| 60. | Marmet | 13.7% | 22.8%(-9.12)#60 | 16.9%(-3.22)#8,542 |
| 61. | Brush Fork | 13.8% | 22.8%(-9.08)#61 | 16.9%(-3.18)#8,563 |
| 62. | Albright | 13.8% | 22.8%(-9.04)#62 | 16.9%(-3.15)#8,584 |
| 63. | Pennsboro | 14.0% | 22.8%(-8.81)#63 | 16.9%(-2.91)#8,705 |
| 64. | Madison | 14.6% | 22.8%(-8.27)#64 | 16.9%(-2.38)#9,001 |
| 65. | Peterstown | 14.8% | 22.8%(-8.02)#65 | 16.9%(-2.12)#9,139 |
| 66. | Lewisburg | 15.0% | 22.8%(-7.83)#66 | 16.9%(-1.93)#9,232 |
| 67. | Elkins | 15.2% | 22.8%(-7.62)#67 | 16.9%(-1.72)#9,341 |
| 68. | Hartford City | 15.3% | 22.8%(-7.58)#68 | 16.9%(-1.68)#9,357 |
| 69. | Pea Ridge | 15.6% | 22.8%(-7.26)#69 | 16.9%(-1.37)#9,541 |
| 70. | Belmont | 15.6% | 22.8%(-7.21)#70 | 16.9%(-1.31)#9,563 |
| 71. | Flemington | 15.7% | 22.8%(-7.15)#71 | 16.9%(-1.25)#9,594 |
| 72. | Nutter Fort | 15.8% | 22.8%(-7.06)#72 | 16.9%(-1.17)#9,633 |
| 73. | Westover | 15.8% | 22.8%(-7.03)#73 | 16.9%(-1.13)#9,655 |
| 74. | Paden City | 16.3% | 22.8%(-6.58)#74 | 16.9%(-0.686)#9,918 |
| 75. | West Union | 16.3% | 22.8%(-6.56)#75 | 16.9%(-0.660)#9,928 |
| 76. | Eleanor | 16.3% | 22.8%(-6.53)#76 | 16.9%(-0.635)#9,937 |
| 77. | West Hamlin | 16.7% | 22.8%(-6.17)#77 | 16.9%(-0.272)#10,098 |
| 78. | Wardensville | 16.7% | 22.8%(-6.17)#78 | 16.9%(-0.272)#10,107 |
| 79. | Prosperity | 16.7% | 22.8%(-6.11)#79 | 16.9%(-0.212)#10,157 |
| 80. | North Hills | 18.4% | 22.8%(-4.45)#80 | 16.9%(+1.44)#10,932 |
| 81. | West Logan | 18.4% | 22.8%(-4.41)#81 | 16.9%(+1.48)#10,950 |
| 82. | Iaeger | 18.4% | 22.8%(-4.41)#82 | 16.9%(+1.48)#10,952 |
| 83. | Union | 18.5% | 22.8%(-4.32)#83 | 16.9%(+1.58)#11,001 |
| 84. | Belington | 18.6% | 22.8%(-4.26)#84 | 16.9%(+1.64)#11,035 |
| 85. | Dunbar | 18.6% | 22.8%(-4.22)#85 | 16.9%(+1.68)#11,060 |
| 86. | Crab Orchard | 18.8% | 22.8%(-4.06)#86 | 16.9%(+1.83)#11,153 |
| 87. | Camden On Gauley | 19.0% | 22.8%(-3.79)#87 | 16.9%(+2.11)#11,285 |
| 88. | Cassville | 19.4% | 22.8%(-3.43)#88 | 16.9%(+2.46)#11,433 |
| 89. | Oak Hill | 19.8% | 22.8%(-3.05)#89 | 16.9%(+2.84)#11,597 |
| 90. | Pullman | 20.0% | 22.8%(-2.83)#90 | 16.9%(+3.06)#11,699 |
| 91. | Frank | 20.0% | 22.8%(-2.83)#91 | 16.9%(+3.06)#11,723 |
| 92. | Paw Paw | 20.2% | 22.8%(-2.62)#92 | 16.9%(+3.27)#11,803 |
| 93. | Welch | 20.4% | 22.8%(-2.42)#93 | 16.9%(+3.48)#11,903 |
| 94. | Farmington | 20.7% | 22.8%(-2.14)#94 | 16.9%(+3.75)#12,033 |
| 95. | Mabscott | 20.7% | 22.8%(-2.09)#95 | 16.9%(+3.81)#12,061 |
| 96. | Tunnelton | 20.8% | 22.8%(-2.00)#96 | 16.9%(+3.89)#12,095 |
| 97. | Hamlin | 20.9% | 22.8%(-1.94)#97 | 16.9%(+3.96)#12,124 |
| 98. | Bath Berkeley Springs | 20.9% | 22.8%(-1.93)#98 | 16.9%(+3.97)#12,132 |
| 99. | Culloden | 21.1% | 22.8%(-1.78)#99 | 16.9%(+4.11)#12,188 |
| 100. | Craigsville | 21.1% | 22.8%(-1.69)#100 | 16.9%(+4.21)#12,229 |
Common Questions
What are the Top 10 Cities with the Lowest Poverty Level Among Children Under the Age of 16 in West Virginia?
Top 10 Cities with the Lowest Poverty Level Among Children Under the Age of 16 in West Virginia are:
#1
1.2%
#2
1.4%
#3
1.5%
#4
2.4%
#5
2.6%
#6
2.6%
#7
2.8%
#8
2.8%
#9
2.9%
#10
3.0%
What city has the Lowest Poverty Level Among Children Under the Age of 16 in West Virginia?
Thomas has the Lowest Poverty Level Among Children Under the Age of 16 in West Virginia with 1.2%.
What is the Poverty Level Among Children Under the Age of 16 in the State of West Virginia?
Poverty Level Among Children Under the Age of 16 in West Virginia is 22.8%.
What is the Poverty Level Among Children Under the Age of 16 in the United States?
Poverty Level Among Children Under the Age of 16 in the United States is 16.9%.