Cities with the Lowest Poverty Level Among Children Under the Age of 16 in Indiana
RELATED REPORTS & OPTIONS
Lowest Poverty | Child 0-16
Indiana
Compare Cities
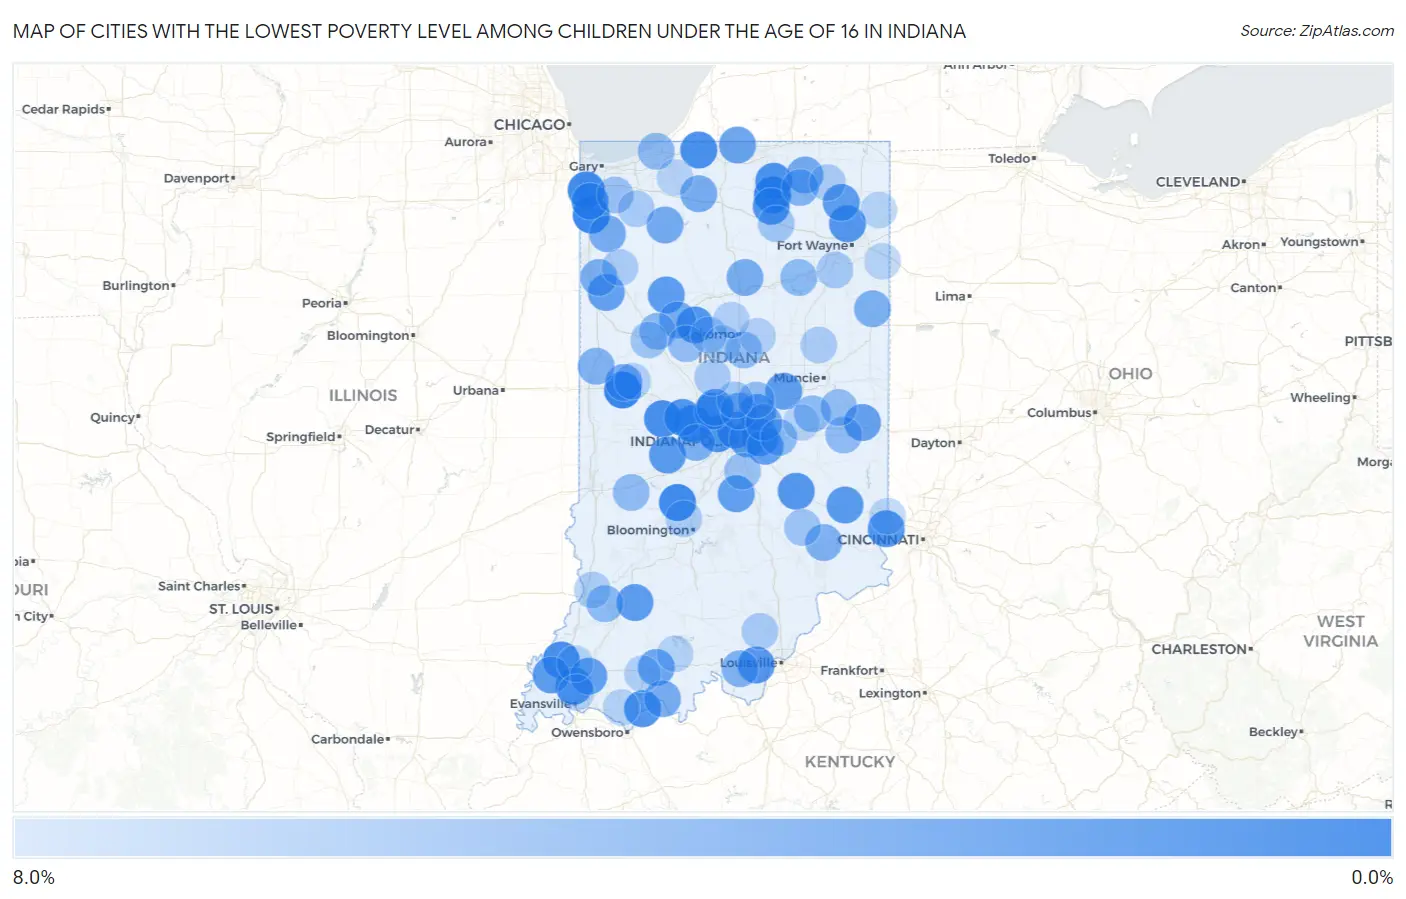
Map of Cities with the Lowest Poverty Level Among Children Under the Age of 16 in Indiana
8.0%
0.0%
Cities with the Lowest Poverty Level Among Children Under the Age of 16 in Indiana
| City | Child Poverty | vs State | vs National | |
| 1. | Hillsboro | 0.59% | 16.4%(-15.9)#1 | 16.9%(-16.4)#90 |
| 2. | Milford | 0.62% | 16.4%(-15.8)#2 | 16.9%(-16.3)#109 |
| 3. | Lowell | 0.76% | 16.4%(-15.7)#3 | 16.9%(-16.2)#160 |
| 4. | St John | 0.99% | 16.4%(-15.5)#4 | 16.9%(-16.0)#274 |
| 5. | Gosport | 1.1% | 16.4%(-15.4)#5 | 16.9%(-15.9)#316 |
| 6. | Lizton | 1.1% | 16.4%(-15.3)#6 | 16.9%(-15.8)#355 |
| 7. | Ladoga | 1.3% | 16.4%(-15.1)#7 | 16.9%(-15.6)#455 |
| 8. | New Carlisle | 1.5% | 16.4%(-15.0)#8 | 16.9%(-15.4)#554 |
| 9. | Owensville | 1.5% | 16.4%(-14.9)#9 | 16.9%(-15.4)#573 |
| 10. | Clermont | 1.7% | 16.4%(-14.8)#10 | 16.9%(-15.3)#674 |
| 11. | New Paris | 1.7% | 16.4%(-14.7)#11 | 16.9%(-15.2)#723 |
| 12. | Grandview | 1.8% | 16.4%(-14.7)#12 | 16.9%(-15.2)#741 |
| 13. | Flora | 1.9% | 16.4%(-14.6)#13 | 16.9%(-15.1)#804 |
| 14. | Rocky Ripple | 1.9% | 16.4%(-14.5)#14 | 16.9%(-15.0)#841 |
| 15. | Hidden Valley | 1.9% | 16.4%(-14.5)#15 | 16.9%(-15.0)#843 |
| 16. | Leesburg | 1.9% | 16.4%(-14.5)#16 | 16.9%(-15.0)#846 |
| 17. | Jamestown | 1.9% | 16.4%(-14.5)#17 | 16.9%(-15.0)#852 |
| 18. | Huntertown | 2.0% | 16.4%(-14.5)#18 | 16.9%(-15.0)#883 |
| 19. | Cedar Lake | 2.0% | 16.4%(-14.5)#19 | 16.9%(-15.0)#891 |
| 20. | Darmstadt | 2.0% | 16.4%(-14.5)#20 | 16.9%(-15.0)#895 |
| 21. | St Paul | 2.1% | 16.4%(-14.4)#21 | 16.9%(-14.8)#967 |
| 22. | Lanesville | 2.1% | 16.4%(-14.4)#22 | 16.9%(-14.8)#969 |
| 23. | Cumberland | 2.2% | 16.4%(-14.2)#23 | 16.9%(-14.7)#1,043 |
| 24. | Oldenburg | 2.3% | 16.4%(-14.1)#24 | 16.9%(-14.6)#1,105 |
| 25. | Whitestown | 2.3% | 16.4%(-14.1)#25 | 16.9%(-14.6)#1,107 |
| 26. | Fillmore | 2.3% | 16.4%(-14.1)#26 | 16.9%(-14.6)#1,131 |
| 27. | Avilla | 2.4% | 16.4%(-14.0)#27 | 16.9%(-14.5)#1,170 |
| 28. | Warren Park | 2.4% | 16.4%(-14.0)#28 | 16.9%(-14.5)#1,173 |
| 29. | Monticello | 2.4% | 16.4%(-14.0)#29 | 16.9%(-14.5)#1,179 |
| 30. | Montgomery | 2.5% | 16.4%(-14.0)#30 | 16.9%(-14.5)#1,216 |
| 31. | Zionsville | 2.5% | 16.4%(-13.9)#31 | 16.9%(-14.4)#1,252 |
| 32. | Poseyville | 2.6% | 16.4%(-13.9)#32 | 16.9%(-14.4)#1,301 |
| 33. | Edgewood | 2.7% | 16.4%(-13.8)#33 | 16.9%(-14.3)#1,369 |
| 34. | Trafalgar | 2.7% | 16.4%(-13.7)#34 | 16.9%(-14.2)#1,421 |
| 35. | New Palestine | 2.7% | 16.4%(-13.7)#35 | 16.9%(-14.2)#1,426 |
| 36. | Fishers | 2.8% | 16.4%(-13.7)#36 | 16.9%(-14.2)#1,441 |
| 37. | Elberfeld | 2.8% | 16.4%(-13.6)#37 | 16.9%(-14.1)#1,477 |
| 38. | Goodland | 2.9% | 16.4%(-13.6)#38 | 16.9%(-14.1)#1,507 |
| 39. | Greens Fork | 3.0% | 16.4%(-13.4)#39 | 16.9%(-13.9)#1,625 |
| 40. | Granger | 3.1% | 16.4%(-13.4)#40 | 16.9%(-13.8)#1,667 |
| 41. | Ferdinand | 3.2% | 16.4%(-13.3)#41 | 16.9%(-13.8)#1,735 |
| 42. | Mellott | 3.6% | 16.4%(-12.9)#42 | 16.9%(-13.4)#1,998 |
| 43. | Topeka | 3.6% | 16.4%(-12.8)#43 | 16.9%(-13.3)#2,051 |
| 44. | North Judson | 3.7% | 16.4%(-12.8)#44 | 16.9%(-13.3)#2,060 |
| 45. | Troy | 3.9% | 16.4%(-12.6)#45 | 16.9%(-13.1)#2,189 |
| 46. | Roselawn | 3.9% | 16.4%(-12.6)#46 | 16.9%(-13.1)#2,194 |
| 47. | Delphi | 3.9% | 16.4%(-12.5)#47 | 16.9%(-13.0)#2,206 |
| 48. | Koontz Lake | 3.9% | 16.4%(-12.5)#48 | 16.9%(-13.0)#2,232 |
| 49. | Carmel | 4.0% | 16.4%(-12.5)#49 | 16.9%(-13.0)#2,268 |
| 50. | Denver | 4.0% | 16.4%(-12.4)#50 | 16.9%(-12.9)#2,281 |
| 51. | Brook | 4.0% | 16.4%(-12.4)#51 | 16.9%(-12.9)#2,302 |
| 52. | Mccordsville | 4.0% | 16.4%(-12.4)#52 | 16.9%(-12.9)#2,305 |
| 53. | Danville | 4.2% | 16.4%(-12.2)#53 | 16.9%(-12.7)#2,428 |
| 54. | Berne | 4.2% | 16.4%(-12.2)#54 | 16.9%(-12.7)#2,432 |
| 55. | Holton | 4.3% | 16.4%(-12.1)#55 | 16.9%(-12.6)#2,515 |
| 56. | Ligonier | 4.4% | 16.4%(-12.0)#56 | 16.9%(-12.5)#2,550 |
| 57. | West Lebanon | 4.4% | 16.4%(-12.0)#57 | 16.9%(-12.5)#2,560 |
| 58. | Corydon | 4.4% | 16.4%(-12.0)#58 | 16.9%(-12.5)#2,587 |
| 59. | Battle Ground | 4.9% | 16.4%(-11.6)#59 | 16.9%(-12.1)#2,867 |
| 60. | Wheatland | 4.9% | 16.4%(-11.5)#60 | 16.9%(-12.0)#2,930 |
| 61. | Andrews | 5.0% | 16.4%(-11.5)#61 | 16.9%(-12.0)#2,959 |
| 62. | Greenfield | 5.0% | 16.4%(-11.5)#62 | 16.9%(-12.0)#2,961 |
| 63. | Cadiz | 5.0% | 16.4%(-11.4)#63 | 16.9%(-11.9)#2,982 |
| 64. | Trail Creek | 5.1% | 16.4%(-11.4)#64 | 16.9%(-11.9)#3,012 |
| 65. | Center Point | 5.2% | 16.4%(-11.2)#65 | 16.9%(-11.7)#3,122 |
| 66. | Dublin | 5.2% | 16.4%(-11.2)#66 | 16.9%(-11.7)#3,133 |
| 67. | Mooreland | 5.3% | 16.4%(-11.2)#67 | 16.9%(-11.7)#3,156 |
| 68. | Sharpsville | 5.3% | 16.4%(-11.2)#68 | 16.9%(-11.6)#3,173 |
| 69. | Noblesville | 5.4% | 16.4%(-11.1)#69 | 16.9%(-11.6)#3,221 |
| 70. | Rossville | 5.4% | 16.4%(-11.0)#70 | 16.9%(-11.5)#3,270 |
| 71. | Lakes Of The Four Seasons | 5.7% | 16.4%(-10.8)#71 | 16.9%(-11.3)#3,451 |
| 72. | New Whiteland | 5.7% | 16.4%(-10.7)#72 | 16.9%(-11.2)#3,496 |
| 73. | Westport | 5.8% | 16.4%(-10.6)#73 | 16.9%(-11.1)#3,567 |
| 74. | West Lafayette | 6.1% | 16.4%(-10.4)#74 | 16.9%(-10.9)#3,735 |
| 75. | Winona Lake | 6.1% | 16.4%(-10.4)#75 | 16.9%(-10.9)#3,750 |
| 76. | Burlington | 6.2% | 16.4%(-10.3)#76 | 16.9%(-10.8)#3,803 |
| 77. | Westfield | 6.2% | 16.4%(-10.3)#77 | 16.9%(-10.8)#3,813 |
| 78. | Zanesville | 6.2% | 16.4%(-10.2)#78 | 16.9%(-10.7)#3,871 |
| 79. | Russiaville | 6.4% | 16.4%(-10.0)#79 | 16.9%(-10.5)#3,969 |
| 80. | Kouts | 6.5% | 16.4%(-9.96)#80 | 16.9%(-10.5)#4,024 |
| 81. | Borden | 6.5% | 16.4%(-9.91)#81 | 16.9%(-10.4)#4,058 |
| 82. | Kirklin | 6.5% | 16.4%(-9.90)#82 | 16.9%(-10.4)#4,063 |
| 83. | Bruceville | 6.6% | 16.4%(-9.87)#83 | 16.9%(-10.4)#4,081 |
| 84. | Rensselaer | 6.6% | 16.4%(-9.86)#84 | 16.9%(-10.4)#4,087 |
| 85. | Ellettsville | 6.6% | 16.4%(-9.85)#85 | 16.9%(-10.3)#4,094 |
| 86. | Rome City | 6.7% | 16.4%(-9.78)#86 | 16.9%(-10.3)#4,144 |
| 87. | Shamrock Lakes | 6.7% | 16.4%(-9.78)#87 | 16.9%(-10.3)#4,152 |
| 88. | Wingate | 6.8% | 16.4%(-9.63)#88 | 16.9%(-10.1)#4,238 |
| 89. | Dale | 6.8% | 16.4%(-9.60)#89 | 16.9%(-10.1)#4,256 |
| 90. | Greentown | 6.9% | 16.4%(-9.53)#90 | 16.9%(-10.0)#4,313 |
| 91. | Galveston | 6.9% | 16.4%(-9.50)#91 | 16.9%(-9.99)#4,328 |
| 92. | Fort Branch | 7.0% | 16.4%(-9.43)#92 | 16.9%(-9.93)#4,381 |
| 93. | St Joe | 7.0% | 16.4%(-9.43)#93 | 16.9%(-9.92)#4,387 |
| 94. | Monroeville | 7.1% | 16.4%(-9.39)#94 | 16.9%(-9.88)#4,409 |
| 95. | Richland | 7.1% | 16.4%(-9.39)#95 | 16.9%(-9.88)#4,410 |
| 96. | Birdseye | 7.1% | 16.4%(-9.39)#96 | 16.9%(-9.88)#4,411 |
| 97. | West Harrison | 7.1% | 16.4%(-9.30)#97 | 16.9%(-9.80)#4,483 |
| 98. | Kingsbury | 7.1% | 16.4%(-9.30)#98 | 16.9%(-9.80)#4,489 |
| 99. | Shirley | 7.2% | 16.4%(-9.28)#99 | 16.9%(-9.77)#4,505 |
| 100. | Highland | 7.2% | 16.4%(-9.28)#100 | 16.9%(-9.77)#4,506 |
Common Questions
What are the Top 10 Cities with the Lowest Poverty Level Among Children Under the Age of 16 in Indiana?
Top 10 Cities with the Lowest Poverty Level Among Children Under the Age of 16 in Indiana are:
#1
0.59%
#2
0.62%
#3
0.76%
#4
0.99%
#5
1.1%
#6
1.1%
#7
1.3%
#8
1.5%
#9
1.5%
#10
1.7%
What city has the Lowest Poverty Level Among Children Under the Age of 16 in Indiana?
Hillsboro has the Lowest Poverty Level Among Children Under the Age of 16 in Indiana with 0.59%.
What is the Poverty Level Among Children Under the Age of 16 in the State of Indiana?
Poverty Level Among Children Under the Age of 16 in Indiana is 16.4%.
What is the Poverty Level Among Children Under the Age of 16 in the United States?
Poverty Level Among Children Under the Age of 16 in the United States is 16.9%.