Cities with the Lowest Poverty Level Among Children Under the Age of 16 in Mississippi
RELATED REPORTS & OPTIONS
Lowest Poverty | Child 0-16
Mississippi
Compare Cities
Map of Cities with the Lowest Poverty Level Among Children Under the Age of 16 in Mississippi
25.0%
0.0%
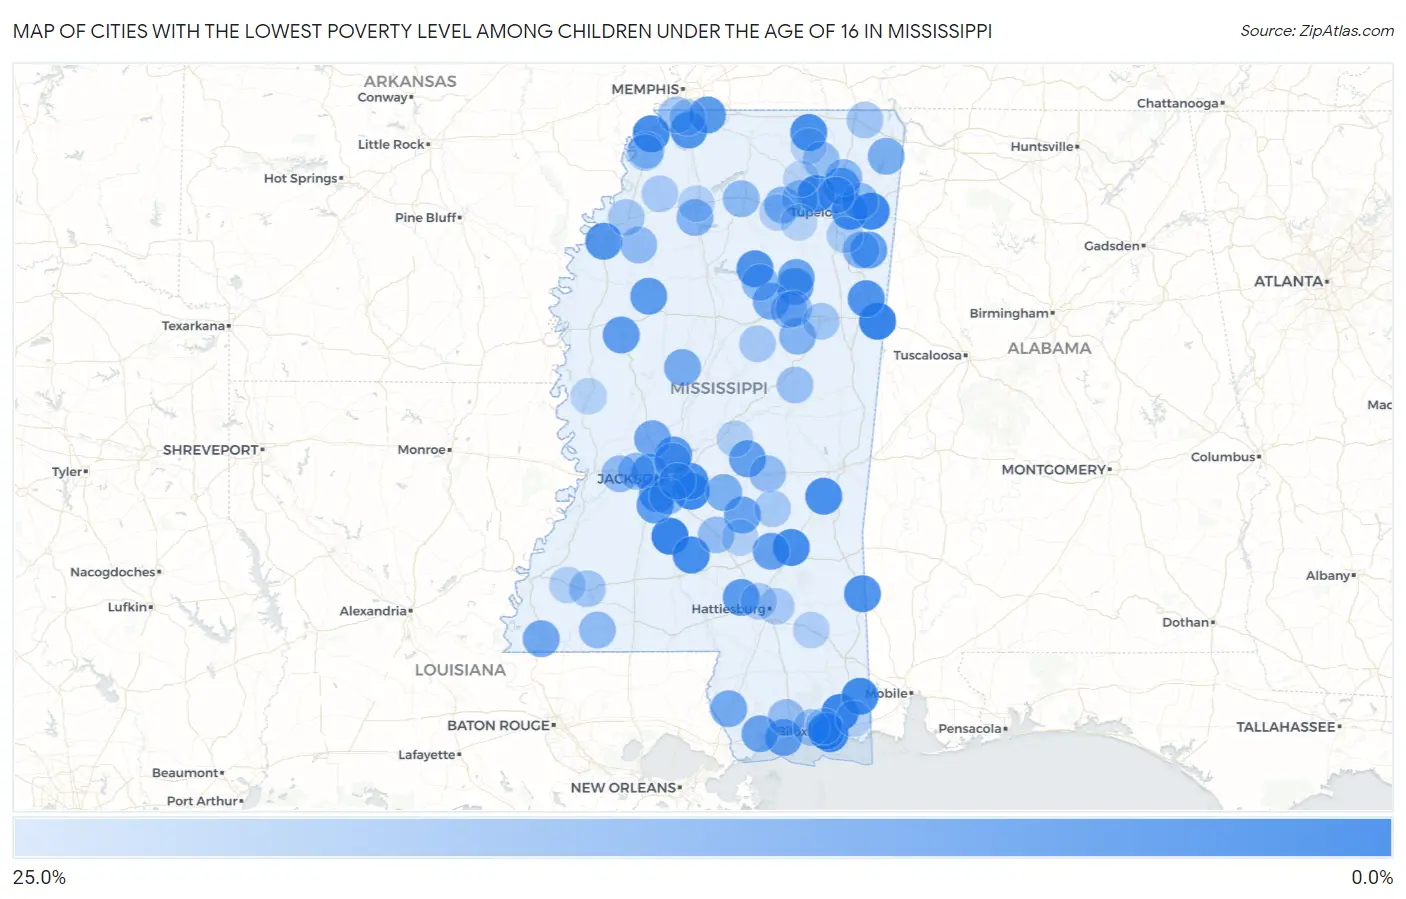
Cities with the Lowest Poverty Level Among Children Under the Age of 16 in Mississippi
| City | Child Poverty | vs State | vs National | |
| 1. | New Hope | 1.4% | 27.4% (-26.0)#1 | 16.9% (-15.5)#526 |
| 2. | Georgetown | 1.5% | 27.4% (-25.9)#2 | 16.9% (-15.4)#559 |
| 3. | Vancleave | 2.1% | 27.4% (-25.3)#3 | 16.9% (-14.9)#966 |
| 4. | Blue Springs | 2.4% | 27.4% (-25.1)#4 | 16.9% (-14.6)#1,151 |
| 5. | Gulf Park Estates | 2.6% | 27.4% (-24.8)#5 | 16.9% (-14.3)#1,341 |
| 6. | Fulton | 2.8% | 27.4% (-24.6)#6 | 16.9% (-14.1)#1,479 |
| 7. | Robinhood | 3.0% | 27.4% (-24.5)#7 | 16.9% (-14.0)#1,578 |
| 8. | Hurley | 3.0% | 27.4% (-24.4)#8 | 16.9% (-13.9)#1,617 |
| 9. | Ocean Springs | 3.3% | 27.4% (-24.1)#9 | 16.9% (-13.6)#1,848 |
| 10. | Sharon | 3.6% | 27.4% (-23.9)#10 | 16.9% (-13.4)#1,992 |
| 11. | New Hebron | 3.6% | 27.4% (-23.8)#11 | 16.9% (-13.3)#2,045 |
| 12. | Tunica Resorts | 3.8% | 27.4% (-23.7)#12 | 16.9% (-13.2)#2,127 |
| 13. | Mooreville | 4.0% | 27.4% (-23.4)#13 | 16.9% (-13.0)#2,267 |
| 14. | Enterprise | 4.3% | 27.4% (-23.2)#14 | 16.9% (-12.7)#2,457 |
| 15. | Falkner | 4.3% | 27.4% (-23.1)#15 | 16.9% (-12.6)#2,476 |
| 16. | State Line | 5.0% | 27.4% (-22.4)#16 | 16.9% (-11.9)#3,002 |
| 17. | Columbus Afb | 5.1% | 27.4% (-22.3)#17 | 16.9% (-11.8)#3,049 |
| 18. | Big Creek | 5.3% | 27.4% (-22.2)#18 | 16.9% (-11.7)#3,162 |
| 19. | Brandon | 5.5% | 27.4% (-21.9)#19 | 16.9% (-11.4)#3,321 |
| 20. | Hernando | 5.7% | 27.4% (-21.8)#20 | 16.9% (-11.3)#3,432 |
| 21. | Duncan | 5.9% | 27.4% (-21.6)#21 | 16.9% (-11.1)#3,596 |
| 22. | Olive Branch | 6.8% | 27.4% (-20.6)#22 | 16.9% (-10.1)#4,247 |
| 23. | Madison | 7.0% | 27.4% (-20.5)#23 | 16.9% (-9.97)#4,349 |
| 24. | Byram | 7.0% | 27.4% (-20.4)#24 | 16.9% (-9.93)#4,380 |
| 25. | Sumrall | 7.5% | 27.4% (-20.0)#25 | 16.9% (-9.46)#4,700 |
| 26. | Schlater | 7.5% | 27.4% (-19.9)#26 | 16.9% (-9.44)#4,720 |
| 27. | Winterville | 7.5% | 27.4% (-19.9)#27 | 16.9% (-9.44)#4,722 |
| 28. | Clinton | 7.8% | 27.4% (-19.7)#28 | 16.9% (-9.19)#4,877 |
| 29. | Guntown | 7.8% | 27.4% (-19.6)#29 | 16.9% (-9.09)#4,941 |
| 30. | Inverness | 8.2% | 27.4% (-19.3)#30 | 16.9% (-8.76)#5,148 |
| 31. | Terry | 8.2% | 27.4% (-19.2)#31 | 16.9% (-8.71)#5,164 |
| 32. | Mantee | 8.2% | 27.4% (-19.2)#32 | 16.9% (-8.70)#5,173 |
| 33. | Gluckstadt | 8.4% | 27.4% (-19.1)#33 | 16.9% (-8.57)#5,281 |
| 34. | Hatley | 8.5% | 27.4% (-18.9)#34 | 16.9% (-8.41)#5,380 |
| 35. | Long Beach | 9.0% | 27.4% (-18.4)#35 | 16.9% (-7.94)#5,721 |
| 36. | Hillsboro | 9.0% | 27.4% (-18.4)#36 | 16.9% (-7.90)#5,746 |
| 37. | Soso | 9.2% | 27.4% (-18.2)#37 | 16.9% (-7.74)#5,857 |
| 38. | Raleigh | 9.4% | 27.4% (-18.1)#38 | 16.9% (-7.56)#5,965 |
| 39. | Diamondhead | 9.5% | 27.4% (-17.9)#39 | 16.9% (-7.42)#6,057 |
| 40. | Woodland | 10.0% | 27.4% (-17.4)#40 | 16.9% (-6.94)#6,378 |
| 41. | Kearney Park | 10.9% | 27.4% (-16.6)#41 | 16.9% (-6.08)#6,878 |
| 42. | Woodville | 10.9% | 27.4% (-16.6)#42 | 16.9% (-6.05)#6,896 |
| 43. | Walthall | 11.1% | 27.4% (-16.3)#43 | 16.9% (-5.83)#7,069 |
| 44. | Hide A Way Lake | 11.3% | 27.4% (-16.1)#44 | 16.9% (-5.63)#7,173 |
| 45. | Lexington | 11.8% | 27.4% (-15.7)#45 | 16.9% (-5.17)#7,439 |
| 46. | Paden | 12.5% | 27.4% (-14.9)#46 | 16.9% (-4.44)#7,906 |
| 47. | Polkville | 13.0% | 27.4% (-14.4)#47 | 16.9% (-3.94)#8,160 |
| 48. | Pope | 13.8% | 27.4% (-13.6)#48 | 16.9% (-3.11)#8,612 |
| 49. | Thaxton | 14.2% | 27.4% (-13.3)#49 | 16.9% (-2.77)#8,784 |
| 50. | Sturgis | 14.3% | 27.4% (-13.1)#50 | 16.9% (-2.65)#8,870 |
| 51. | Ridgeland | 14.4% | 27.4% (-13.0)#51 | 16.9% (-2.50)#8,953 |
| 52. | Amory | 14.6% | 27.4% (-12.9)#52 | 16.9% (-2.37)#9,004 |
| 53. | Mantachie | 15.2% | 27.4% (-12.2)#53 | 16.9% (-1.72)#9,343 |
| 54. | Oxford | 15.3% | 27.4% (-12.1)#54 | 16.9% (-1.64)#9,388 |
| 55. | Baldwyn | 15.4% | 27.4% (-12.1)#55 | 16.9% (-1.57)#9,424 |
| 56. | Slate Springs | 15.4% | 27.4% (-12.1)#56 | 16.9% (-1.55)#9,452 |
| 57. | Cleary | 15.5% | 27.4% (-11.9)#57 | 16.9% (-1.45)#9,489 |
| 58. | Pearl | 15.5% | 27.4% (-11.9)#58 | 16.9% (-1.44)#9,497 |
| 59. | Mathiston | 15.6% | 27.4% (-11.9)#59 | 16.9% (-1.38)#9,529 |
| 60. | Edwards | 15.9% | 27.4% (-11.6)#60 | 16.9% (-1.08)#9,692 |
| 61. | Liberty | 16.1% | 27.4% (-11.3)#61 | 16.9% (-0.832)#9,819 |
| 62. | Tutwiler | 16.1% | 27.4% (-11.3)#62 | 16.9% (-0.821)#9,824 |
| 63. | Lake | 16.4% | 27.4% (-11.0)#63 | 16.9% (-0.546)#9,986 |
| 64. | Ecru | 16.4% | 27.4% (-11.0)#64 | 16.9% (-0.537)#9,989 |
| 65. | Saltillo | 16.5% | 27.4% (-10.9)#65 | 16.9% (-0.438)#10,035 |
| 66. | Bolton | 16.7% | 27.4% (-10.8)#66 | 16.9% (-0.272)#10,093 |
| 67. | Magee | 16.7% | 27.4% (-10.7)#67 | 16.9% (-0.245)#10,143 |
| 68. | Dumas | 17.1% | 27.4% (-10.3)#68 | 16.9% (+0.204)#10,346 |
| 69. | Lyman | 17.2% | 27.4% (-10.3)#69 | 16.9% (+0.216)#10,357 |
| 70. | Maben | 17.3% | 27.4% (-10.1)#70 | 16.9% (+0.382)#10,440 |
| 71. | Noxapater | 17.6% | 27.4% (-9.84)#71 | 16.9% (+0.653)#10,570 |
| 72. | Lynchburg | 17.7% | 27.4% (-9.71)#72 | 16.9% (+0.782)#10,623 |
| 73. | North Tunica | 18.0% | 27.4% (-9.43)#73 | 16.9% (+1.06)#10,752 |
| 74. | Biloxi | 18.2% | 27.4% (-9.20)#74 | 16.9% (+1.30)#10,876 |
| 75. | Meadville | 18.6% | 27.4% (-8.79)#75 | 16.9% (+1.70)#11,076 |
| 76. | Starkville | 18.7% | 27.4% (-8.77)#76 | 16.9% (+1.72)#11,085 |
| 77. | Farmington | 18.8% | 27.4% (-8.64)#77 | 16.9% (+1.86)#11,162 |
| 78. | Lyon | 19.1% | 27.4% (-8.32)#78 | 16.9% (+2.18)#11,309 |
| 79. | Gulf Hills | 19.3% | 27.4% (-8.12)#79 | 16.9% (+2.37)#11,392 |
| 80. | French Camp | 19.4% | 27.4% (-7.99)#80 | 16.9% (+2.51)#11,458 |
| 81. | Louin | 19.7% | 27.4% (-7.72)#81 | 16.9% (+2.78)#11,572 |
| 82. | Tunica | 19.8% | 27.4% (-7.68)#82 | 16.9% (+2.81)#11,588 |
| 83. | Southaven | 19.8% | 27.4% (-7.60)#83 | 16.9% (+2.89)#11,618 |
| 84. | Petal | 20.0% | 27.4% (-7.45)#84 | 16.9% (+3.04)#11,672 |
| 85. | Falcon | 20.0% | 27.4% (-7.43)#85 | 16.9% (+3.06)#11,710 |
| 86. | Bovina | 20.2% | 27.4% (-7.21)#86 | 16.9% (+3.29)#11,810 |
| 87. | Rawls Springs | 20.3% | 27.4% (-7.18)#87 | 16.9% (+3.32)#11,823 |
| 88. | Nettleton | 20.3% | 27.4% (-7.14)#88 | 16.9% (+3.36)#11,844 |
| 89. | Roxie | 21.0% | 27.4% (-6.44)#89 | 16.9% (+4.06)#12,164 |
| 90. | Toccopola | 21.1% | 27.4% (-6.38)#90 | 16.9% (+4.11)#12,196 |
| 91. | Lena | 21.1% | 27.4% (-6.38)#91 | 16.9% (+4.11)#12,204 |
| 92. | Beaumont | 21.2% | 27.4% (-6.22)#92 | 16.9% (+4.27)#12,256 |
| 93. | Batesville | 21.3% | 27.4% (-6.09)#93 | 16.9% (+4.40)#12,316 |
| 94. | Escatawpa | 21.4% | 27.4% (-5.99)#94 | 16.9% (+4.51)#12,371 |
| 95. | Benton | 21.6% | 27.4% (-5.87)#95 | 16.9% (+4.63)#12,422 |
| 96. | Mize | 21.6% | 27.4% (-5.81)#96 | 16.9% (+4.68)#12,444 |
| 97. | Algoma | 21.8% | 27.4% (-5.67)#97 | 16.9% (+4.82)#12,487 |
| 98. | Ripley | 21.8% | 27.4% (-5.67)#98 | 16.9% (+4.83)#12,488 |
| 99. | Rolling Fork | 21.8% | 27.4% (-5.59)#99 | 16.9% (+4.90)#12,526 |
| 100. | New Albany | 22.2% | 27.4% (-5.24)#100 | 16.9% (+5.25)#12,655 |
Common Questions
What are the Top 10 Cities with the Lowest Poverty Level Among Children Under the Age of 16 in Mississippi?
Top 10 Cities with the Lowest Poverty Level Among Children Under the Age of 16 in Mississippi are:
#1
1.4%
#2
1.5%
#3
2.1%
#4
2.4%
#5
2.6%
#6
2.8%
#7
3.0%
#8
3.0%
#9
3.3%
#10
3.6%
What city has the Lowest Poverty Level Among Children Under the Age of 16 in Mississippi?
New Hope has the Lowest Poverty Level Among Children Under the Age of 16 in Mississippi with 1.4%.
What is the Poverty Level Among Children Under the Age of 16 in the State of Mississippi?
Poverty Level Among Children Under the Age of 16 in Mississippi is 27.4%.
What is the Poverty Level Among Children Under the Age of 16 in the United States?
Poverty Level Among Children Under the Age of 16 in the United States is 16.9%.