Cities with the Lowest Poverty Level Among Children Under the Age of 16 in Montana
RELATED REPORTS & OPTIONS
Lowest Poverty | Child 0-16
Montana
Compare Cities
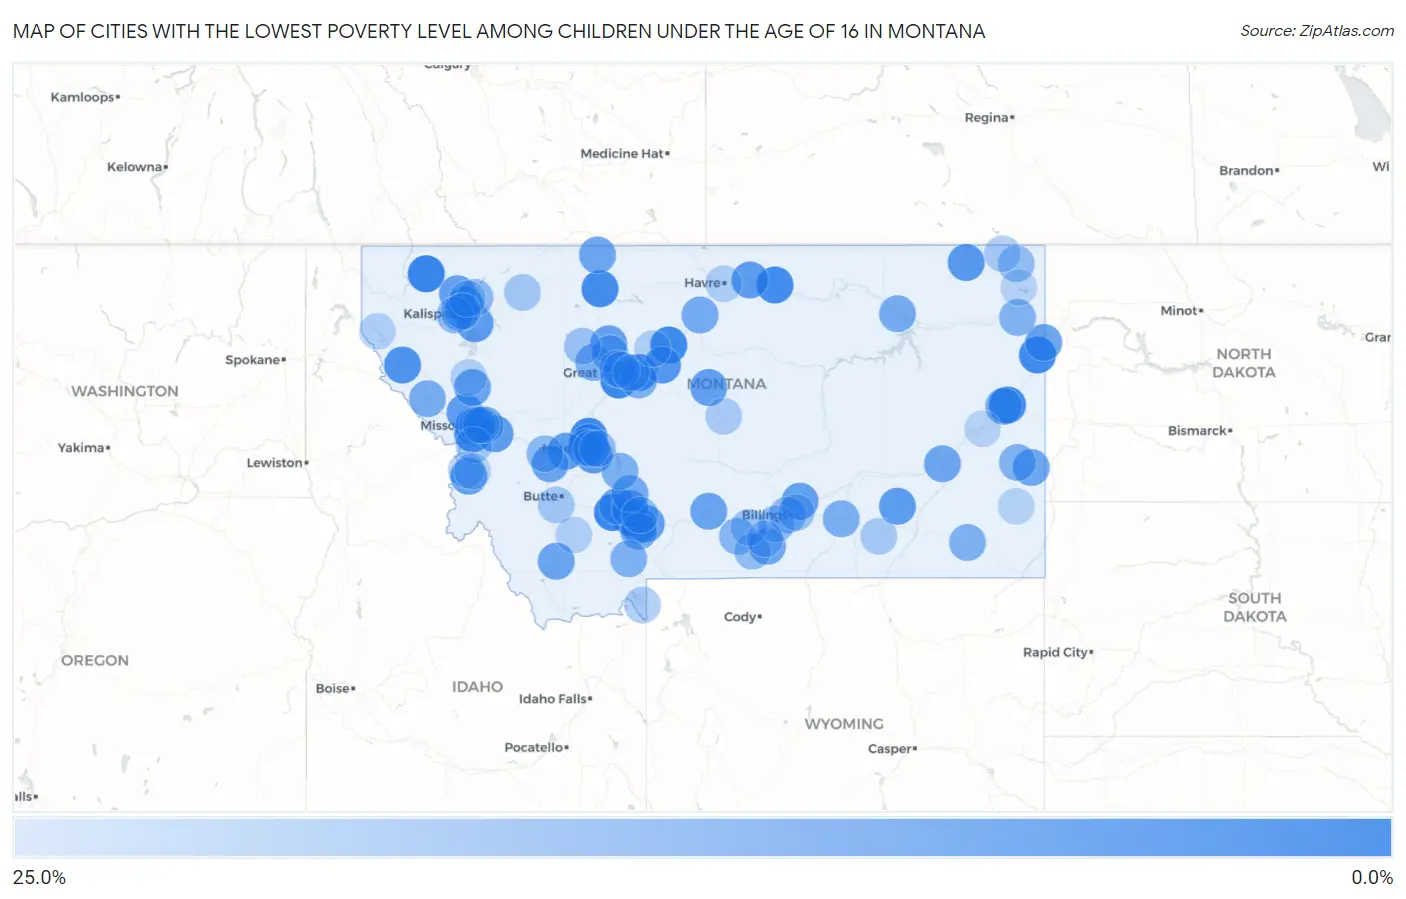
Map of Cities with the Lowest Poverty Level Among Children Under the Age of 16 in Montana
25.0%
0.0%
Cities with the Lowest Poverty Level Among Children Under the Age of 16 in Montana
| City | Child Poverty | vs State | vs National | |
| 1. | Trego | 1.1% | 15.0%(-14.0)#1 | 16.9%(-15.9)#317 |
| 2. | Churchill | 1.3% | 15.0%(-13.7)#2 | 16.9%(-15.6)#463 |
| 3. | Glendive | 1.6% | 15.0%(-13.4)#3 | 16.9%(-15.3)#641 |
| 4. | Willow Creek | 1.9% | 15.0%(-13.1)#4 | 16.9%(-15.1)#822 |
| 5. | Orchard Homes | 1.9% | 15.0%(-13.1)#5 | 16.9%(-15.0)#849 |
| 6. | Ulm | 2.0% | 15.0%(-13.0)#6 | 16.9%(-15.0)#902 |
| 7. | Fort Benton | 2.4% | 15.0%(-12.6)#7 | 16.9%(-14.5)#1,169 |
| 8. | Sidney | 2.5% | 15.0%(-12.5)#8 | 16.9%(-14.4)#1,245 |
| 9. | Helena Valley Northwest | 2.6% | 15.0%(-12.4)#9 | 16.9%(-14.4)#1,310 |
| 10. | Shelby | 2.7% | 15.0%(-12.4)#10 | 16.9%(-14.3)#1,374 |
| 11. | Harlem | 2.8% | 15.0%(-12.2)#11 | 16.9%(-14.2)#1,467 |
| 12. | Helena Valley West Central | 3.3% | 15.0%(-11.7)#12 | 16.9%(-13.6)#1,822 |
| 13. | Lolo | 4.3% | 15.0%(-10.7)#13 | 16.9%(-12.6)#2,481 |
| 14. | Malmstrom Afb | 4.4% | 15.0%(-10.6)#14 | 16.9%(-12.5)#2,551 |
| 15. | Thompson Falls | 4.8% | 15.0%(-10.3)#15 | 16.9%(-12.2)#2,799 |
| 16. | Highwood | 6.1% | 15.0%(-8.91)#16 | 16.9%(-10.8)#3,787 |
| 17. | Scobey | 6.5% | 15.0%(-8.58)#17 | 16.9%(-10.5)#3,997 |
| 18. | Montana City | 6.5% | 15.0%(-8.52)#18 | 16.9%(-10.4)#4,038 |
| 19. | Chinook | 6.9% | 15.0%(-8.14)#19 | 16.9%(-10.1)#4,287 |
| 20. | Bigfork | 7.0% | 15.0%(-8.03)#20 | 16.9%(-9.94)#4,372 |
| 21. | Colstrip | 7.1% | 15.0%(-7.89)#21 | 16.9%(-9.80)#4,465 |
| 22. | Clinton | 7.2% | 15.0%(-7.79)#22 | 16.9%(-9.70)#4,543 |
| 23. | Helena West Side | 7.3% | 15.0%(-7.74)#23 | 16.9%(-9.65)#4,575 |
| 24. | Bozeman | 7.4% | 15.0%(-7.62)#24 | 16.9%(-9.53)#4,648 |
| 25. | Elliston | 7.5% | 15.0%(-7.53)#25 | 16.9%(-9.44)#4,721 |
| 26. | Helena Flats | 7.7% | 15.0%(-7.29)#26 | 16.9%(-9.20)#4,870 |
| 27. | Frenchtown | 7.9% | 15.0%(-7.12)#27 | 16.9%(-9.03)#4,982 |
| 28. | Shepherd | 7.9% | 15.0%(-7.08)#28 | 16.9%(-8.99)#5,008 |
| 29. | Denton | 8.1% | 15.0%(-6.92)#29 | 16.9%(-8.83)#5,101 |
| 30. | Hamilton | 8.2% | 15.0%(-6.86)#30 | 16.9%(-8.77)#5,144 |
| 31. | Four Corners | 8.3% | 15.0%(-6.71)#31 | 16.9%(-8.62)#5,229 |
| 32. | Whitefish | 8.4% | 15.0%(-6.61)#32 | 16.9%(-8.52)#5,314 |
| 33. | Three Forks | 8.9% | 15.0%(-6.16)#33 | 16.9%(-8.07)#5,622 |
| 34. | Fairview | 9.0% | 15.0%(-5.99)#34 | 16.9%(-7.90)#5,743 |
| 35. | Kalispell | 9.1% | 15.0%(-5.97)#35 | 16.9%(-7.88)#5,755 |
| 36. | Dutton | 9.1% | 15.0%(-5.94)#36 | 16.9%(-7.85)#5,794 |
| 37. | Deer Lodge | 9.2% | 15.0%(-5.79)#37 | 16.9%(-7.70)#5,875 |
| 38. | Manhattan | 9.3% | 15.0%(-5.68)#38 | 16.9%(-7.59)#5,948 |
| 39. | St Ignatius | 9.4% | 15.0%(-5.64)#39 | 16.9%(-7.55)#5,978 |
| 40. | Dillon | 9.5% | 15.0%(-5.51)#40 | 16.9%(-7.42)#6,053 |
| 41. | Bonner West Riverside | 9.7% | 15.0%(-5.37)#41 | 16.9%(-7.28)#6,144 |
| 42. | Big Timber | 9.7% | 15.0%(-5.34)#42 | 16.9%(-7.25)#6,160 |
| 43. | Sunburst | 9.9% | 15.0%(-5.15)#43 | 16.9%(-7.06)#6,267 |
| 44. | Baker | 9.9% | 15.0%(-5.13)#44 | 16.9%(-7.04)#6,291 |
| 45. | Fromberg | 10.0% | 15.0%(-5.03)#45 | 16.9%(-6.94)#6,358 |
| 46. | Miles City | 10.3% | 15.0%(-4.74)#46 | 16.9%(-6.65)#6,537 |
| 47. | Ponderosa Pines | 10.8% | 15.0%(-4.19)#47 | 16.9%(-6.10)#6,859 |
| 48. | Big Sandy | 11.2% | 15.0%(-3.79)#48 | 16.9%(-5.70)#7,134 |
| 49. | Glasgow | 11.5% | 15.0%(-3.56)#49 | 16.9%(-5.47)#7,265 |
| 50. | West Glendive | 11.7% | 15.0%(-3.36)#50 | 16.9%(-5.27)#7,381 |
| 51. | Superior | 11.9% | 15.0%(-3.12)#51 | 16.9%(-5.03)#7,528 |
| 52. | Helena | 11.9% | 15.0%(-3.12)#52 | 16.9%(-5.03)#7,534 |
| 53. | Gallatin Gateway | 12.0% | 15.0%(-2.99)#53 | 16.9%(-4.90)#7,617 |
| 54. | Hardin | 12.3% | 15.0%(-2.75)#54 | 16.9%(-4.66)#7,760 |
| 55. | Fairfield | 12.5% | 15.0%(-2.53)#55 | 16.9%(-4.44)#7,885 |
| 56. | Sand Coulee | 12.5% | 15.0%(-2.53)#56 | 16.9%(-4.44)#7,895 |
| 57. | Power | 12.5% | 15.0%(-2.53)#57 | 16.9%(-4.44)#7,898 |
| 58. | Townsend | 12.7% | 15.0%(-2.28)#58 | 16.9%(-4.19)#8,031 |
| 59. | Missoula | 12.7% | 15.0%(-2.28)#59 | 16.9%(-4.19)#8,033 |
| 60. | Plevna | 13.0% | 15.0%(-2.07)#60 | 16.9%(-3.98)#8,149 |
| 61. | Broadus | 13.2% | 15.0%(-1.87)#61 | 16.9%(-3.78)#8,247 |
| 62. | Big Sky | 13.2% | 15.0%(-1.84)#62 | 16.9%(-3.75)#8,262 |
| 63. | Culbertson | 13.8% | 15.0%(-1.24)#63 | 16.9%(-3.15)#8,579 |
| 64. | Absarokee | 14.5% | 15.0%(-0.536)#64 | 16.9%(-2.45)#8,974 |
| 65. | Billings | 15.0% | 15.0%(-0.027)#65 | 16.9%(-1.94)#9,230 |
| 66. | Hungry Horse | 15.1% | 15.0%(+0.025)#66 | 16.9%(-1.89)#9,251 |
| 67. | Garrison | 15.2% | 15.0%(+0.188)#67 | 16.9%(-1.72)#9,347 |
| 68. | Laurel | 16.0% | 15.0%(+0.989)#68 | 16.9%(-0.921)#9,771 |
| 69. | Batavia | 16.0% | 15.0%(+1.02)#69 | 16.9%(-0.890)#9,791 |
| 70. | Plentywood | 16.1% | 15.0%(+1.04)#70 | 16.9%(-0.875)#9,797 |
| 71. | Roberts | 16.2% | 15.0%(+1.19)#71 | 16.9%(-0.723)#9,898 |
| 72. | Belgrade | 16.4% | 15.0%(+1.34)#72 | 16.9%(-0.566)#9,976 |
| 73. | East Helena | 16.5% | 15.0%(+1.45)#73 | 16.9%(-0.464)#10,027 |
| 74. | Vaughn | 17.1% | 15.0%(+2.03)#74 | 16.9%(+0.120)#10,299 |
| 75. | Choteau | 17.3% | 15.0%(+2.25)#75 | 16.9%(+0.345)#10,419 |
| 76. | Lockwood | 17.9% | 15.0%(+2.83)#76 | 16.9%(+0.923)#10,693 |
| 77. | Sun Prairie | 18.1% | 15.0%(+3.03)#77 | 16.9%(+1.12)#10,781 |
| 78. | Columbus | 18.1% | 15.0%(+3.06)#78 | 16.9%(+1.15)#10,795 |
| 79. | Great Falls | 18.7% | 15.0%(+3.70)#79 | 16.9%(+1.79)#11,115 |
| 80. | Butte Silver Bow Balance | 18.8% | 15.0%(+3.73)#80 | 16.9%(+1.82)#11,147 |
| 81. | East Glacier Park Village | 18.9% | 15.0%(+3.89)#81 | 16.9%(+1.98)#11,222 |
| 82. | Florence | 19.2% | 15.0%(+4.16)#82 | 16.9%(+2.25)#11,338 |
| 83. | West Yellowstone | 19.8% | 15.0%(+4.78)#83 | 16.9%(+2.87)#11,604 |
| 84. | Columbia Falls | 19.9% | 15.0%(+4.83)#84 | 16.9%(+2.92)#11,638 |
| 85. | Busby | 19.9% | 15.0%(+4.84)#85 | 16.9%(+2.93)#11,642 |
| 86. | Moore | 20.0% | 15.0%(+4.97)#86 | 16.9%(+3.06)#11,702 |
| 87. | Outlook | 20.0% | 15.0%(+4.97)#87 | 16.9%(+3.06)#11,731 |
| 88. | Joliet | 20.3% | 15.0%(+5.24)#88 | 16.9%(+3.33)#11,830 |
| 89. | East Missoula | 20.5% | 15.0%(+5.48)#89 | 16.9%(+3.57)#11,947 |
| 90. | Pinesdale | 20.7% | 15.0%(+5.67)#90 | 16.9%(+3.76)#12,045 |
| 91. | Havre | 20.7% | 15.0%(+5.70)#91 | 16.9%(+3.79)#12,053 |
| 92. | Carter | 20.8% | 15.0%(+5.80)#92 | 16.9%(+3.89)#12,106 |
| 93. | Charlo | 21.1% | 15.0%(+6.02)#93 | 16.9%(+4.11)#12,194 |
| 94. | Twin Bridges | 21.1% | 15.0%(+6.02)#94 | 16.9%(+4.11)#12,198 |
| 95. | Noxon | 21.1% | 15.0%(+6.02)#95 | 16.9%(+4.11)#12,199 |
| 96. | Corvallis | 21.6% | 15.0%(+6.55)#96 | 16.9%(+4.64)#12,426 |
| 97. | Evergreen | 21.6% | 15.0%(+6.57)#97 | 16.9%(+4.66)#12,430 |
| 98. | Ekalaka | 21.7% | 15.0%(+6.71)#98 | 16.9%(+4.80)#12,481 |
| 99. | Fallon | 22.1% | 15.0%(+7.05)#99 | 16.9%(+5.14)#12,622 |
| 100. | Medicine Lake | 22.2% | 15.0%(+7.19)#100 | 16.9%(+5.28)#12,678 |
Common Questions
What are the Top 10 Cities with the Lowest Poverty Level Among Children Under the Age of 16 in Montana?
Top 10 Cities with the Lowest Poverty Level Among Children Under the Age of 16 in Montana are:
#1
1.1%
#2
1.3%
#3
1.6%
#4
1.9%
#5
1.9%
#6
2.0%
#7
2.4%
#8
2.5%
#9
2.6%
#10
2.7%
What city has the Lowest Poverty Level Among Children Under the Age of 16 in Montana?
Trego has the Lowest Poverty Level Among Children Under the Age of 16 in Montana with 1.1%.
What is the Poverty Level Among Children Under the Age of 16 in the State of Montana?
Poverty Level Among Children Under the Age of 16 in Montana is 15.0%.
What is the Poverty Level Among Children Under the Age of 16 in the United States?
Poverty Level Among Children Under the Age of 16 in the United States is 16.9%.