Cities with the Lowest Poverty Level Among Children Under the Age of 16 in Arizona
RELATED REPORTS & OPTIONS
Lowest Poverty | Child 0-16
Arizona
Compare Cities
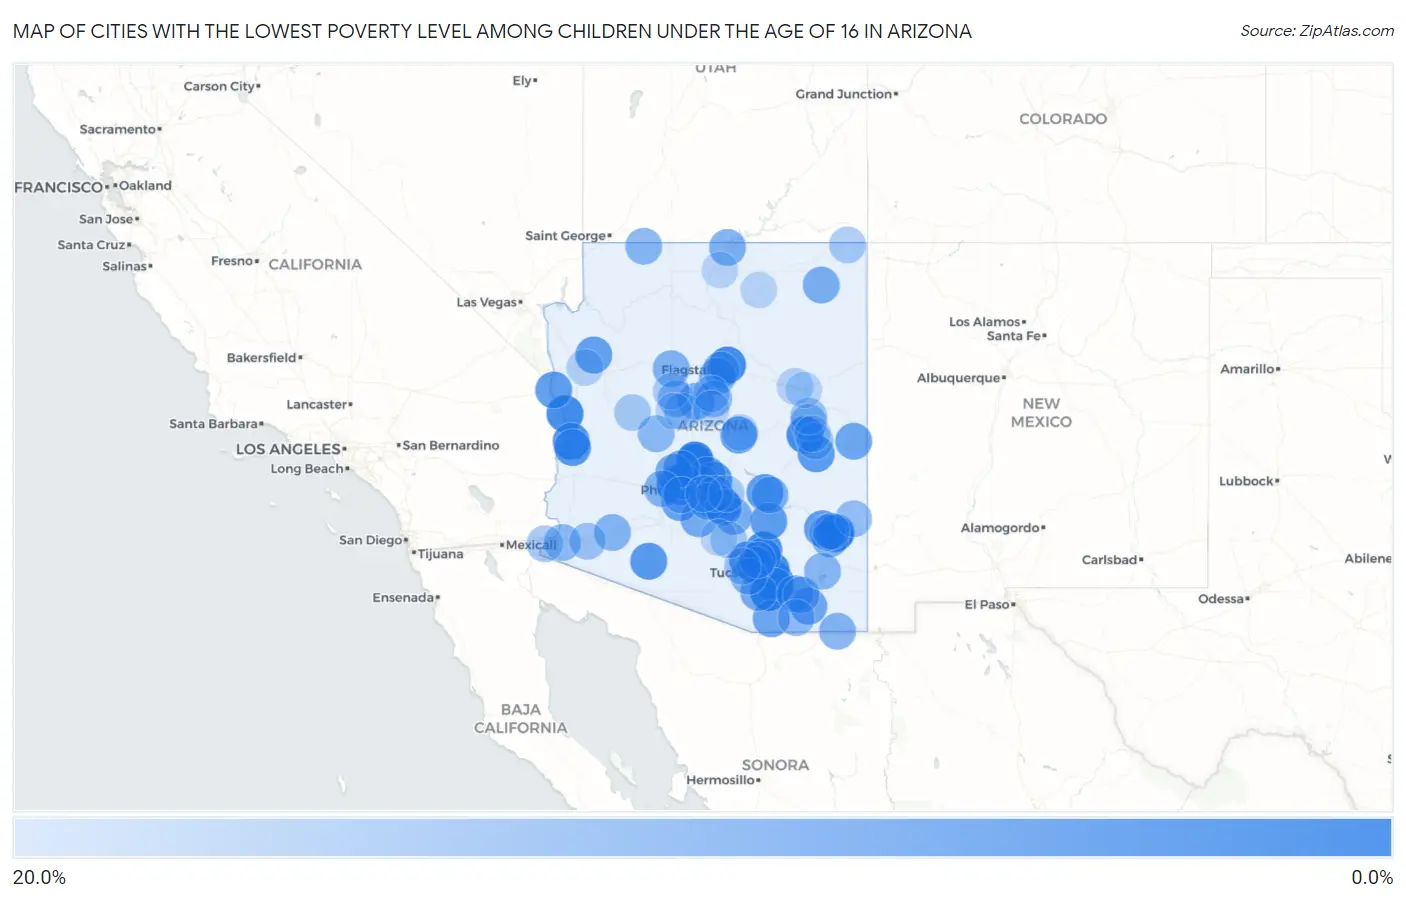
Map of Cities with the Lowest Poverty Level Among Children Under the Age of 16 in Arizona
20.0%
0.0%
Cities with the Lowest Poverty Level Among Children Under the Age of 16 in Arizona
| City | Child Poverty | vs State | vs National | |
| 1. | Corona De Tucson | 0.52% | 18.1%(-17.6)#1 | 16.9%(-16.4)#68 |
| 2. | Tucson Mountains | 0.87% | 18.1%(-17.3)#2 | 16.9%(-16.1)#221 |
| 3. | Litchfield Park | 1.1% | 18.1%(-17.0)#3 | 16.9%(-15.8)#346 |
| 4. | Anthem | 1.4% | 18.1%(-16.8)#4 | 16.9%(-15.6)#482 |
| 5. | Solomon | 1.5% | 18.1%(-16.6)#5 | 16.9%(-15.4)#565 |
| 6. | New River | 1.6% | 18.1%(-16.5)#6 | 16.9%(-15.3)#654 |
| 7. | Doney Park | 1.9% | 18.1%(-16.2)#7 | 16.9%(-15.0)#832 |
| 8. | Rincon Valley | 1.9% | 18.1%(-16.2)#8 | 16.9%(-15.0)#850 |
| 9. | Desert Hills | 2.1% | 18.1%(-16.0)#9 | 16.9%(-14.8)#971 |
| 10. | Catalina Foothills | 2.3% | 18.1%(-15.8)#10 | 16.9%(-14.6)#1,119 |
| 11. | Tanque Verde | 2.3% | 18.1%(-15.8)#11 | 16.9%(-14.6)#1,120 |
| 12. | Saddlebrooke | 2.6% | 18.1%(-15.5)#12 | 16.9%(-14.3)#1,328 |
| 13. | Linden | 2.8% | 18.1%(-15.4)#13 | 16.9%(-14.2)#1,439 |
| 14. | Bluewater | 3.4% | 18.1%(-14.7)#14 | 16.9%(-13.5)#1,916 |
| 15. | Catalina | 3.5% | 18.1%(-14.6)#15 | 16.9%(-13.4)#1,982 |
| 16. | Red Rock Cdp Pinal County | 3.6% | 18.1%(-14.5)#16 | 16.9%(-13.4)#2,002 |
| 17. | Citrus Park | 4.6% | 18.1%(-13.5)#17 | 16.9%(-12.3)#2,704 |
| 18. | Queen Creek | 4.8% | 18.1%(-13.3)#18 | 16.9%(-12.1)#2,846 |
| 19. | Marana | 4.9% | 18.1%(-13.3)#19 | 16.9%(-12.1)#2,873 |
| 20. | Fountain Hills | 4.9% | 18.1%(-13.2)#20 | 16.9%(-12.0)#2,914 |
| 21. | Parker | 5.0% | 18.1%(-13.1)#21 | 16.9%(-11.9)#2,964 |
| 22. | Ajo | 5.0% | 18.1%(-13.1)#22 | 16.9%(-11.9)#2,967 |
| 23. | North Fork | 5.4% | 18.1%(-12.8)#23 | 16.9%(-11.6)#3,223 |
| 24. | Payson | 5.6% | 18.1%(-12.5)#24 | 16.9%(-11.4)#3,385 |
| 25. | Claypool | 5.7% | 18.1%(-12.4)#25 | 16.9%(-11.2)#3,462 |
| 26. | Hayden | 5.8% | 18.1%(-12.4)#26 | 16.9%(-11.2)#3,516 |
| 27. | Gilbert | 5.9% | 18.1%(-12.2)#27 | 16.9%(-11.0)#3,632 |
| 28. | Paradise Valley | 5.9% | 18.1%(-12.2)#28 | 16.9%(-11.0)#3,635 |
| 29. | Mohave Valley | 6.0% | 18.1%(-12.1)#29 | 16.9%(-10.9)#3,718 |
| 30. | Pima | 6.4% | 18.1%(-11.7)#30 | 16.9%(-10.5)#3,962 |
| 31. | Valle Vista | 6.5% | 18.1%(-11.6)#31 | 16.9%(-10.4)#4,042 |
| 32. | Vail | 6.9% | 18.1%(-11.2)#32 | 16.9%(-10.0)#4,292 |
| 33. | Casas Adobes | 7.0% | 18.1%(-11.2)#33 | 16.9%(-9.97)#4,347 |
| 34. | Goodyear | 7.3% | 18.1%(-10.8)#34 | 16.9%(-9.62)#4,592 |
| 35. | Red Lake | 7.3% | 18.1%(-10.8)#35 | 16.9%(-9.61)#4,613 |
| 36. | Springerville | 8.2% | 18.1%(-9.89)#36 | 16.9%(-8.71)#5,168 |
| 37. | Scottsdale | 8.4% | 18.1%(-9.76)#37 | 16.9%(-8.57)#5,283 |
| 38. | Tombstone | 8.5% | 18.1%(-9.65)#38 | 16.9%(-8.46)#5,343 |
| 39. | Patagonia | 8.6% | 18.1%(-9.53)#39 | 16.9%(-8.35)#5,418 |
| 40. | Youngtown | 8.6% | 18.1%(-9.48)#40 | 16.9%(-8.30)#5,458 |
| 41. | San Jose | 8.7% | 18.1%(-9.37)#41 | 16.9%(-8.19)#5,528 |
| 42. | Surprise | 8.9% | 18.1%(-9.22)#42 | 16.9%(-8.03)#5,643 |
| 43. | Maricopa | 9.3% | 18.1%(-8.87)#43 | 16.9%(-7.69)#5,890 |
| 44. | Sahuarita | 9.3% | 18.1%(-8.84)#44 | 16.9%(-7.65)#5,911 |
| 45. | Rough Rock | 9.8% | 18.1%(-8.29)#45 | 16.9%(-7.10)#6,245 |
| 46. | Benson | 10.0% | 18.1%(-8.12)#46 | 16.9%(-6.94)#6,336 |
| 47. | Florence | 10.0% | 18.1%(-8.09)#47 | 16.9%(-6.91)#6,398 |
| 48. | Peoria | 10.1% | 18.1%(-8.01)#48 | 16.9%(-6.83)#6,433 |
| 49. | Page | 10.1% | 18.1%(-7.98)#49 | 16.9%(-6.80)#6,447 |
| 50. | Swift Trail Junction | 10.3% | 18.1%(-7.80)#50 | 16.9%(-6.61)#6,551 |
| 51. | Chandler | 10.4% | 18.1%(-7.77)#51 | 16.9%(-6.58)#6,574 |
| 52. | Clarkdale | 10.5% | 18.1%(-7.64)#52 | 16.9%(-6.46)#6,640 |
| 53. | Globe | 10.7% | 18.1%(-7.39)#53 | 16.9%(-6.20)#6,801 |
| 54. | St David | 10.9% | 18.1%(-7.22)#54 | 16.9%(-6.03)#6,907 |
| 55. | Ash Fork | 10.9% | 18.1%(-7.21)#55 | 16.9%(-6.03)#6,911 |
| 56. | San Tan Valley | 11.1% | 18.1%(-7.06)#56 | 16.9%(-5.87)#7,001 |
| 57. | Buckeye | 11.1% | 18.1%(-7.06)#57 | 16.9%(-5.87)#7,003 |
| 58. | Pirtleville | 11.1% | 18.1%(-7.01)#58 | 16.9%(-5.83)#7,035 |
| 59. | Kachina Village | 11.1% | 18.1%(-6.98)#59 | 16.9%(-5.79)#7,087 |
| 60. | Dateland | 11.5% | 18.1%(-6.65)#60 | 16.9%(-5.46)#7,272 |
| 61. | Flagstaff | 11.6% | 18.1%(-6.54)#61 | 16.9%(-5.36)#7,337 |
| 62. | Tucson Estates | 11.7% | 18.1%(-6.47)#62 | 16.9%(-5.29)#7,372 |
| 63. | Centennial Park | 11.7% | 18.1%(-6.43)#63 | 16.9%(-5.25)#7,402 |
| 64. | Willcox | 12.1% | 18.1%(-6.04)#64 | 16.9%(-4.86)#7,638 |
| 65. | Village Of Oak Creek Big Park | 12.3% | 18.1%(-5.78)#65 | 16.9%(-4.60)#7,792 |
| 66. | Fortuna Foothills | 12.4% | 18.1%(-5.68)#66 | 16.9%(-4.50)#7,852 |
| 67. | Peeples Valley | 12.5% | 18.1%(-5.62)#67 | 16.9%(-4.44)#7,886 |
| 68. | Chino Valley | 12.7% | 18.1%(-5.38)#68 | 16.9%(-4.20)#8,025 |
| 69. | Oro Valley | 13.0% | 18.1%(-5.10)#69 | 16.9%(-3.92)#8,171 |
| 70. | Thatcher | 13.1% | 18.1%(-5.06)#70 | 16.9%(-3.87)#8,203 |
| 71. | Taylor | 13.1% | 18.1%(-4.98)#71 | 16.9%(-3.80)#8,241 |
| 72. | Sierra Vista | 13.3% | 18.1%(-4.81)#72 | 16.9%(-3.63)#8,323 |
| 73. | Clifton | 13.8% | 18.1%(-4.30)#73 | 16.9%(-3.12)#8,609 |
| 74. | Avondale | 13.9% | 18.1%(-4.25)#74 | 16.9%(-3.07)#8,627 |
| 75. | Picture Rocks | 14.6% | 18.1%(-3.54)#75 | 16.9%(-2.35)#9,023 |
| 76. | Tacna | 14.8% | 18.1%(-3.35)#76 | 16.9%(-2.17)#9,115 |
| 77. | Pinetop Lakeside | 14.9% | 18.1%(-3.24)#77 | 16.9%(-2.06)#9,165 |
| 78. | Safford | 15.1% | 18.1%(-2.98)#78 | 16.9%(-1.80)#9,300 |
| 79. | Prescott Valley | 15.3% | 18.1%(-2.87)#79 | 16.9%(-1.69)#9,354 |
| 80. | Snowflake | 15.6% | 18.1%(-2.55)#80 | 16.9%(-1.37)#9,542 |
| 81. | Wall Lane | 15.6% | 18.1%(-2.55)#81 | 16.9%(-1.37)#9,543 |
| 82. | Sedona | 15.6% | 18.1%(-2.51)#82 | 16.9%(-1.32)#9,559 |
| 83. | Red Mesa | 15.9% | 18.1%(-2.24)#83 | 16.9%(-1.05)#9,708 |
| 84. | Picacho | 16.0% | 18.1%(-2.12)#84 | 16.9%(-0.939)#9,762 |
| 85. | Bagdad | 16.1% | 18.1%(-2.05)#85 | 16.9%(-0.869)#9,800 |
| 86. | Mesa | 16.2% | 18.1%(-1.91)#86 | 16.9%(-0.725)#9,888 |
| 87. | Apache Junction | 16.6% | 18.1%(-1.57)#87 | 16.9%(-0.388)#10,051 |
| 88. | Paulden | 17.0% | 18.1%(-1.15)#88 | 16.9%(+0.034)#10,264 |
| 89. | Circle | 17.4% | 18.1%(-0.732)#89 | 16.9%(+0.452)#10,479 |
| 90. | Tempe | 17.8% | 18.1%(-0.364)#90 | 16.9%(+0.821)#10,635 |
| 91. | Kingman | 17.9% | 18.1%(-0.211)#91 | 16.9%(+0.973)#10,713 |
| 92. | Joseph City | 18.2% | 18.1%(+0.080)#92 | 16.9%(+1.26)#10,860 |
| 93. | Lake Montezuma | 18.3% | 18.1%(+0.130)#93 | 16.9%(+1.31)#10,879 |
| 94. | Mesa Del Caballo | 18.4% | 18.1%(+0.238)#94 | 16.9%(+1.42)#10,923 |
| 95. | Show Low | 18.5% | 18.1%(+0.421)#95 | 16.9%(+1.61)#11,018 |
| 96. | Holbrook | 18.6% | 18.1%(+0.436)#96 | 16.9%(+1.62)#11,023 |
| 97. | Prescott | 18.6% | 18.1%(+0.482)#97 | 16.9%(+1.67)#11,054 |
| 98. | Arizona City | 18.7% | 18.1%(+0.604)#98 | 16.9%(+1.79)#11,112 |
| 99. | Tonalea | 18.8% | 18.1%(+0.626)#99 | 16.9%(+1.81)#11,138 |
| 100. | Bitter Springs | 18.8% | 18.1%(+0.700)#100 | 16.9%(+1.88)#11,174 |
Common Questions
What are the Top 10 Cities with the Lowest Poverty Level Among Children Under the Age of 16 in Arizona?
Top 10 Cities with the Lowest Poverty Level Among Children Under the Age of 16 in Arizona are:
#1
0.52%
#2
1.1%
#3
1.4%
#4
1.5%
#5
1.6%
#6
1.9%
#7
1.9%
#8
2.1%
#9
2.3%
#10
2.3%
What city has the Lowest Poverty Level Among Children Under the Age of 16 in Arizona?
Corona de Tucson has the Lowest Poverty Level Among Children Under the Age of 16 in Arizona with 0.52%.
What is the Poverty Level Among Children Under the Age of 16 in the State of Arizona?
Poverty Level Among Children Under the Age of 16 in Arizona is 18.1%.
What is the Poverty Level Among Children Under the Age of 16 in the United States?
Poverty Level Among Children Under the Age of 16 in the United States is 16.9%.