Zip Codes with the Most Immigrants from Netherlands in Palo Alto, CA
On this page
RELATED REPORTS & OPTIONS
Netherlands
Population
Highest PopulationHighest Population DensityLowest Population DensityMale / Female RatioFemale / Male RatioOldest PopulationOldest Population | MaleOldest Population | FemaleYoungest PopulationYoungest Population | MaleYoungest Population | Female
Families and Households
Largest Family SizeLargest Household SizeMost Single FathersMost Single MothersFewest Single FathersFewest Single MothersSmallest Family SizeSmallest Household Size
Female Fertility
Highest Birth Rate | All WomenHighest Birth Rate | Women 35+Highest Birth Rate | Below PovertyHighest Birth Rate | Public IncomeHighest Birth Rate | In Labor ForceLowest Birth Rate | All WomenLowest Birth Rate | Women 35+Lowest Birth Rate | Below PovertyLowest Birth Rate | Public IncomeLowest Birth Rate | In Labor Force
Race (Community Size)
Race (Percentage)
Ancestry (Community Size)
AfricanAmericanArabArgentineanArmenianAssyrian / Chaldean / SyriacAustralianAustrianBangladeshiBelgianBhutaneseBolivianBrazilianBritishBulgarianBurmeseCanadianCentral AmericanCentral American IndianCherokeeChileanChippewaChoctawColombianCroatianCubanCzechCzechoslovakianDanishDominicanDutchEastern EuropeanEcuadorianEgyptianEnglishEuropeanFilipinoFinnishFrenchFrench CanadianGermanGreekGuatemalanHonduranHungarianIcelanderIndian (Asian)IranianIraqiIrishIsraeliItalianJapaneseJordanianKoreanLaotianLebaneseLithuanianMexicanMexican American IndianNative HawaiianNicaraguanNorthern EuropeanNorwegianOkinawanPakistaniPanamanianPeruvianPolishPortuguesePuerto RicanRomanianRussianSalvadoranSamoanScandinavianScotch-IrishScottishSerbianSlovakSloveneSouth AfricanSouth AmericanSpaniardSpanishSri LankanSubsaharan AfricanSwedishSwissSyrianThaiTurkishUkrainianVenezuelanWelshYugoslavian
Ancestry (Percentage)
AfricanAmericanArabArgentineanArmenianAssyrian / Chaldean / SyriacAustralianAustrianBangladeshiBelgianBhutaneseBolivianBrazilianBritishBulgarianBurmeseCanadianCentral AmericanCentral American IndianCherokeeChileanChippewaChoctawColombianCroatianCubanCzechCzechoslovakianDanishDominicanDutchEastern EuropeanEcuadorianEgyptianEnglishEuropeanFilipinoFinnishFrenchFrench CanadianGermanGreekGuatemalanHonduranHungarianIcelanderIndian (Asian)IranianIraqiIrishIsraeliItalianJapaneseJordanianKoreanLaotianLebaneseLithuanianMexicanMexican American IndianNative HawaiianNicaraguanNorthern EuropeanNorwegianOkinawanPakistaniPanamanianPeruvianPolishPortuguesePuerto RicanRomanianRussianSalvadoranSamoanScandinavianScotch-IrishScottishSerbianSlovakSloveneSouth AfricanSouth AmericanSpaniardSpanishSri LankanSubsaharan AfricanSwedishSwissSyrianThaiTurkishUkrainianVenezuelanWelshYugoslavian
Immigrant Origin (Total)
AfricaArgentinaAsiaAustraliaAustriaBelarusBelgiumBrazilBulgariaCanadaCaribbeanCentral AmericaChileChinaColombiaCubaCzechoslovakiaDenmarkEastern AsiaEastern EuropeEgyptEl SalvadorEnglandEuropeFijiFranceGermanyGreeceGuatemalaHondurasHong KongHungaryIndiaIranIraqIrelandIsraelItalyJapanJordanKazakhstanKoreaLatin AmericaLithuaniaMalaysiaMexicoMoroccoNetherlandsNicaraguaNigeriaNorthern AfricaNorthern EuropeOceaniaPakistanPeruPhilippinesPolandPortugalRomaniaRussiaSaudi ArabiaSerbiaSingaporeSouth AfricaSouth AmericaSouth Central AsiaSouth Eastern AsiaSouthern EuropeSpainSri LankaSwedenSwitzerlandTaiwanThailandTrinidad and TobagoTurkeyUkraineVenezuelaVietnamWestern AfricaWestern AsiaWestern Europe
Immigrant Origin (Percentage)
AfricaArgentinaAsiaAustraliaAustriaBelarusBelgiumBrazilBulgariaCanadaCaribbeanCentral AmericaChileChinaColombiaCubaCzechoslovakiaDenmarkEastern AsiaEastern EuropeEgyptEl SalvadorEnglandEuropeFijiFranceGermanyGreeceGuatemalaHondurasHong KongHungaryIndiaIranIraqIrelandIsraelItalyJapanJordanKazakhstanKoreaLatin AmericaLithuaniaMalaysiaMexicoMoroccoNetherlandsNicaraguaNigeriaNorthern AfricaNorthern EuropeOceaniaPakistanPeruPhilippinesPolandPortugalRomaniaRussiaSaudi ArabiaSerbiaSingaporeSouth AfricaSouth AmericaSouth Central AsiaSouth Eastern AsiaSouthern EuropeSpainSri LankaSwedenSwitzerlandTaiwanThailandTrinidad and TobagoTurkeyUkraineVenezuelaVietnamWestern AfricaWestern AsiaWestern Europe
Income
Highest Per Capita IncomeHighest Earnings | MaleHighest Earnings | FemaleHighest Wage/Income Gap ($)Highest Wage/Income Gap (%)Highest Inequality / Gini IndexLowest Per Capita IncomeLowest Earnings | MaleLowest Earnings | FemaleLowest Wage/Income Gap ($)Lowest Wage/Income Gap (%)Lowest Inequality / Gini Index
Income (Families)
Highest Family IncomeLowest Family IncomeFamily Income | $0-10kFamily Income | $100k+Family Income | $200k+
Income (Households)
Highest Household IncomeLowest Household IncomeHousehold Income | $0-10kHousehold Income | $200k+Household Income | $100k+
Poverty
Highest PovertyHighest Poverty | MaleHighest Poverty | FemaleHighest Poverty | Female 18-24Highest Poverty | Female 25-34Highest Poverty | Child 0-5Highest Poverty | Child 0-16Highest Poverty | Boys 0-16Highest Poverty | Girls 0-16Highest Poverty | Seniors 65+Highest Poverty | Seniors 75+ Lowest PovertyLowest Poverty | MaleLowest Poverty | FemaleLowest Poverty | Child 0-5Lowest Poverty | Child 0-16Lowest Poverty | Boys 0-16Lowest Poverty | Girls 0-16Lowest Poverty | Seniors 65+Lowest Poverty | Seniors 75+
Poverty (Families)
Highest Family PovertyHighest Poverty | Married CoupleHighest Poverty | Single MaleHighest Poverty | Single FemaleHighest Poverty | Single MotherLowest Family PovertyLowest Poverty | Married CoupleLowest Poverty | Single MaleLowest Poverty | Single FemaleLowest Poverty | Single Mother
Unemployment
Highest UnemploymentHighest Unemployment | MaleHighest Unemployment | FemaleHighest Unemployment | Youth < 25Highest Unemployment | Senior > 65Lowest UnemploymentLowest Unemployment | MaleLowest Unemployment | FemaleLowest Unemployment | Youth < 25Lowest Unemployment | Senior > 65
Employment Occupations
Architecture & EngineeringArts, Media & EntertainmentBusiness & FinancialCleaning & MaintenanceCommunity & Social Service Computer & MathematicsComputer, Engineering & ScienceConstruction & ExtractionEducation Instruction & LibraryEducation, Arts & MediaFarming, Fishing & ForestryFirefighting & PreventionFood Preparation & ServingHealth Diagnosing & TreatingHealth TechnologistsHealthcare SupportInstallation, Maintenance & RepairLaw EnforcementLegal Services & SupportLife, Physical & Social ScienceManagementMaterial MovingOffice & AdministrationPersonal Care and ServiceProductionSales & RelatedSecurity & ProtectionTransportation
Employment Industries
Accommodation & Food ServicesAdministrative & Support ServicesAgriculture, Fishing & HuntingArts, Entertainment & RecreationConstructionEducational ServicesEnterprise ManagementFinance & InsuranceHealth Care & Social AssistanceInformation & TechnologyManufacturingProfessional & Scientific ServicesPublic AdministrationReal Estate, Rental & LeasingRetail TradeTransportation & WarehousingUtilitiesWholesale Trade
Employer Class
Private Company EmployeesSelf-Employed / IncorporatedSelf-Employed / Not IncorporatedNot-for-profit OrganizationsLocal Government EmployeesState Government EmployeesFederal Government EmployeesUnpaid Family Workers
Commute Time
Longest CommuteLongest Commute | MaleLongest Commute | FemaleShortest CommuteShortest Commute | MaleShortest Commute | Female
Commute Means
School Enrollment
In Private SchoolNursery / PreschoolKindergartenElementary SchoolMiddle SchoolHigh SchoolCollegeUniversity
Education by Degree Field
Computers and MathematicsBio, Nature & AgriculturalPhysical and Health SciencesPsychologySocial SciencesEngineeringMultidisciplinary StudiesScience and EngineeringBusinessEducationLiterature and LanguagesLiberal Arts and HistoryVisual and Performing ArtsCommunicationsArts and Humanities
Occupancy
Finances
Highest Median Housing CostsHighest Property PricesHighest Owner Housing CostsHighest Renter Housing CostsHighest Housing Costs / IncomeLowest Median Housing CostsLowest Property PricesLowest Owner Housing CostsLowest Renter Housing CostsLowest Housing Costs / Income
Physical Characteristics
Palo Alto
States
AlabamaAlaskaArizonaArkansasCaliforniaColoradoConnecticutDelawareDistrict Of ColumbiaFloridaGeorgiaHawaiiIdahoIllinoisIndianaIowaKansasKentuckyLouisianaMaineMarylandMassachusettsMichiganMinnesotaMississippiMissouriMontanaNebraskaNevadaNew HampshireNew JerseyNew MexicoNew YorkNorth CarolinaNorth DakotaOhioOklahomaOregonPennsylvaniaPuerto RicoRhode IslandSouth CarolinaSouth DakotaTennesseeTexasUtahVermontVirginiaWashingtonWest VirginiaWisconsinWyoming
California Cities
AlhambraAnaheimApple ValleyAuburnBakersfieldBerkeleyBeverly HillsBuena ParkCamarilloCanoga ParkCanyon CountryCarlsbadCastro ValleyChicoCitrus HeightsClovisCoronaCosta MesaCovinaCulver CityDanvilleDavisEl CajonElk GroveEscondidoFairfieldFontanaFremontFresnoFullertonGarden GroveGlendaleGlendoraGrass ValleyHaywardHemetHuntington BeachIndioIrvineLa MesaLakewoodLancasterLivermoreLong BeachLos AltosLos AngelesLos GatosMenifeeMercedMission ViejoModestoMountain ViewMurrietaNapaNewport BeachNorth HollywoodNovatoOaklandOceansideOntarioOrangePalm SpringsPalmdalePalo AltoPasadenaPetalumaPleasantonPomonaRancho CordovaRancho CucamongaReddingRedondo BeachRedwood CityRiversideRosevilleSacramentoSalinasSan ClementeSan DiegoSan FranciscoSan GabrielSan JoseSan Luis ObispoSan MarcosSan MateoSan RafaelSanta AnaSanta BarbaraSanta ClaraSanta ClaritaSanta CruzSanta MariaSanta RosaSherman OaksSpring ValleyStocktonSunnyvaleTemeculaThousand OaksTorranceTrabuco CanyonTracyTurlockUplandVacavilleValenciaVallejoVan NuysVenturaVisaliaWalnut CreekWhittierWoodlandWoodland HillsYorba Linda
Compare Zip Codes
Comparison Subject
Compare StatesCompare CitiesCompare Zip Codes
Map of Zip Codes with the Most Immigrants from Netherlands in Palo Alto
15
77
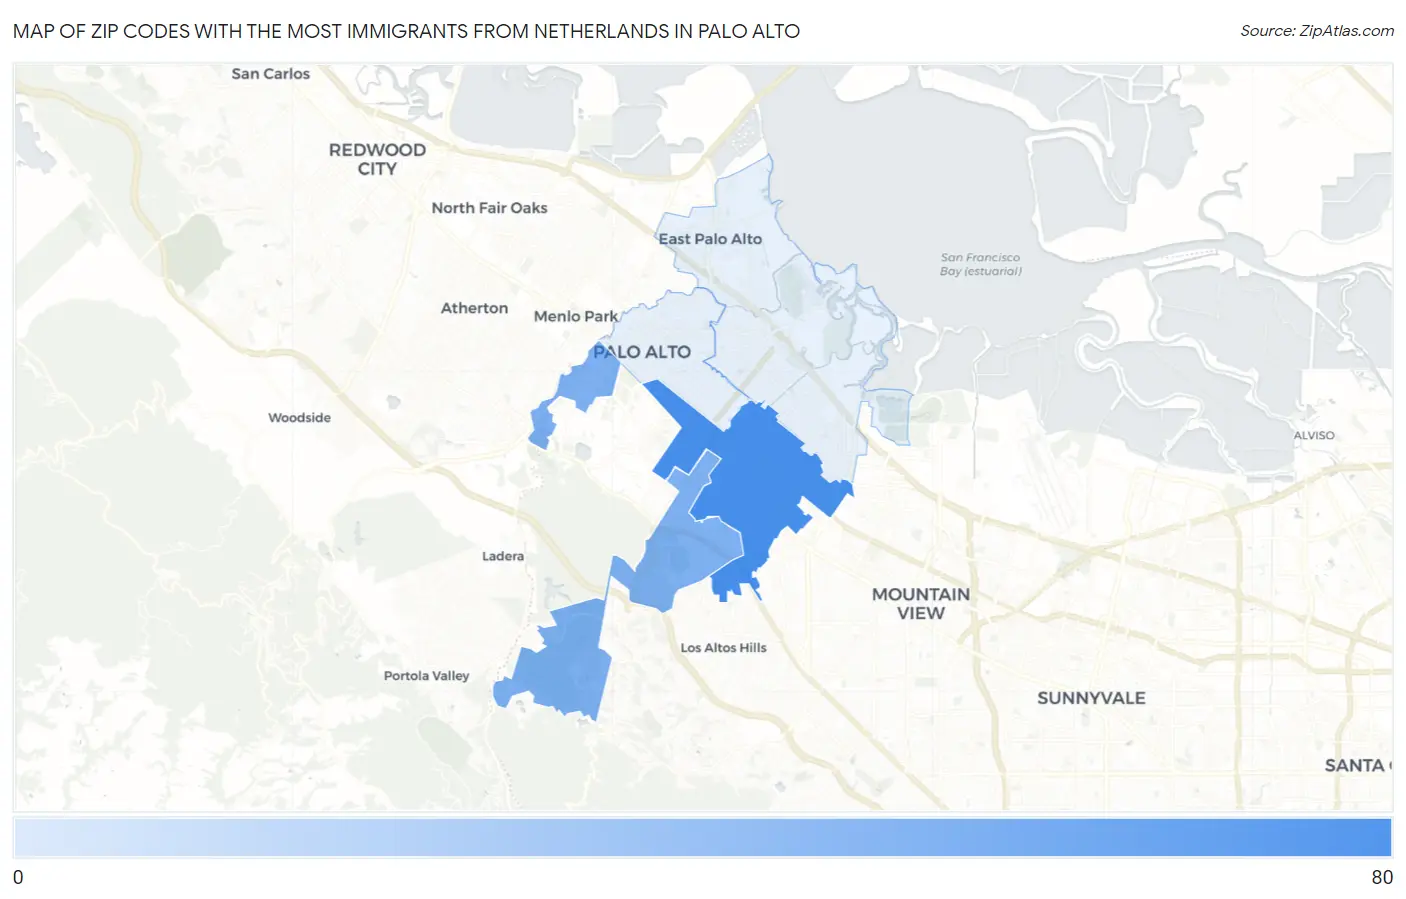
Zip Codes with the Most Immigrants from Netherlands in Palo Alto, CA
| Zip Code | Netherlands | vs State | vs National | |
| 1. | 94306 | 77 | 17,937(0.43%)#37 | 83,187(0.09%)#134 |
| 2. | 94304 | 15 | 17,937(0.08%)#392 | 83,187(0.02%)#1,765 |
1
Common Questions
What are the Top 3 Zip Codes with the Most Immigrants from Netherlands in Palo Alto, CA?
Top 3 Zip Codes with the Most Immigrants from Netherlands in Palo Alto, CA are:
What zip code has the Most Immigrants from Netherlands in Palo Alto, CA?
94306 has the Most Immigrants from Netherlands in Palo Alto, CA with 77.
What is the Total Immigrants from Netherlands in Palo Alto, CA?
Total Immigrants from Netherlands in Palo Alto is 92.
What is the Total Immigrants from Netherlands in California?
Total Immigrants from Netherlands in California is 17,937.
What is the Total Immigrants from Netherlands in the United States?
Total Immigrants from Netherlands in the United States is 83,187.