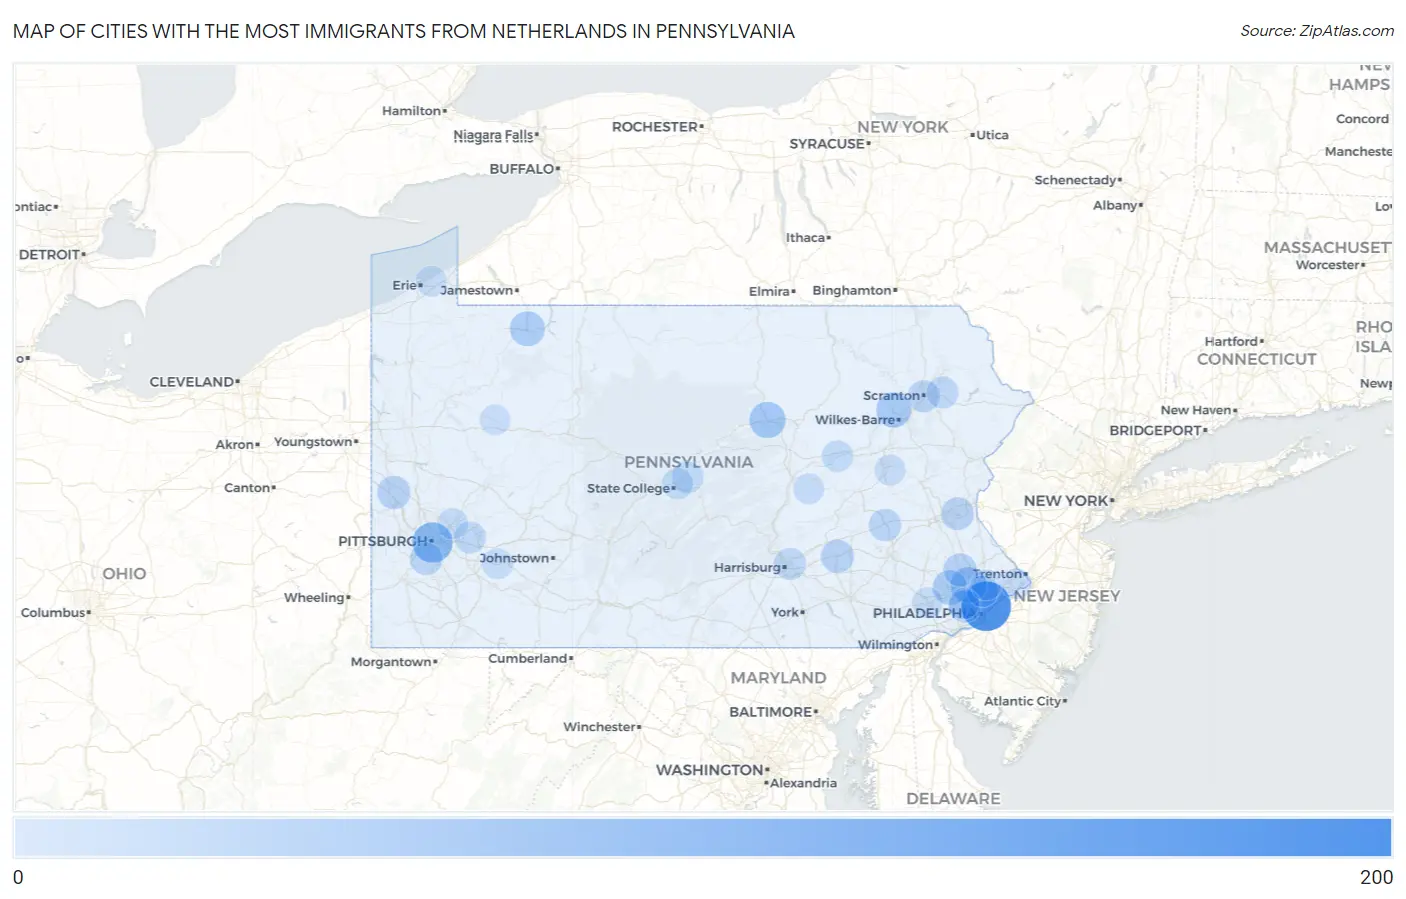
Cities with the Most Immigrants from Netherlands in Pennsylvania
RELATED REPORTS & OPTIONS
Netherlands
Pennsylvania
Compare Cities
Map of Cities with the Most Immigrants from Netherlands in Pennsylvania
0
200
Cities with the Most Immigrants from Netherlands in Pennsylvania
| City | Netherlands | vs State | vs National | |
| 1. | Philadelphia | 162 | 2,004(8.08%)#1 | 83,187(0.19%)#40 |
| 2. | Pittsburgh | 83 | 2,004(4.14%)#2 | 83,187(0.10%)#130 |
| 3. | Chambersburg Borough | 56 | 2,004(2.79%)#3 | 83,187(0.07%)#243 |
| 4. | Williamsport | 48 | 2,004(2.40%)#4 | 83,187(0.06%)#287 |
| 5. | Blue Bell | 48 | 2,004(2.40%)#5 | 83,187(0.06%)#289 |
| 6. | Trucksville | 40 | 2,004(2.00%)#6 | 83,187(0.05%)#362 |
| 7. | Warren | 38 | 2,004(1.90%)#7 | 83,187(0.05%)#387 |
| 8. | Audubon | 37 | 2,004(1.85%)#8 | 83,187(0.04%)#397 |
| 9. | Swarthmore Borough | 37 | 2,004(1.85%)#9 | 83,187(0.04%)#399 |
| 10. | Darby Borough | 27 | 2,004(1.35%)#10 | 83,187(0.03%)#581 |
| 11. | Lebanon | 25 | 2,004(1.25%)#11 | 83,187(0.03%)#635 |
| 12. | Beaver Falls | 25 | 2,004(1.25%)#12 | 83,187(0.03%)#643 |
| 13. | Kulpsville | 24 | 2,004(1.20%)#13 | 83,187(0.03%)#663 |
| 14. | Bethlehem | 21 | 2,004(1.05%)#14 | 83,187(0.03%)#726 |
| 15. | Bethel Park | 20 | 2,004(1.00%)#15 | 83,187(0.02%)#782 |
| 16. | Ardmore | 18 | 2,004(0.90%)#16 | 83,187(0.02%)#864 |
| 17. | Delmont Borough | 18 | 2,004(0.90%)#17 | 83,187(0.02%)#877 |
| 18. | West Hamburg | 18 | 2,004(0.90%)#18 | 83,187(0.02%)#880 |
| 19. | Royersford Borough | 17 | 2,004(0.85%)#19 | 83,187(0.02%)#928 |
| 20. | Scranton | 15 | 2,004(0.75%)#20 | 83,187(0.02%)#980 |
| 21. | Murrysville | 14 | 2,004(0.70%)#21 | 83,187(0.02%)#1,051 |
| 22. | Progress | 14 | 2,004(0.70%)#22 | 83,187(0.02%)#1,063 |
| 23. | Mount Cobb | 14 | 2,004(0.70%)#23 | 83,187(0.02%)#1,086 |
| 24. | Pleasant Gap | 12 | 2,004(0.60%)#24 | 83,187(0.01%)#1,222 |
| 25. | Glenside | 11 | 2,004(0.55%)#25 | 83,187(0.01%)#1,292 |
| 26. | Espy | 11 | 2,004(0.55%)#26 | 83,187(0.01%)#1,308 |
| 27. | Pleasureville | 9 | 2,004(0.45%)#27 | 83,187(0.01%)#1,490 |
| 28. | Harwick | 8 | 2,004(0.40%)#28 | 83,187(0.01%)#1,607 |
| 29. | Bryn Mawr | 7 | 2,004(0.35%)#29 | 83,187(0.01%)#1,669 |
| 30. | St. Davids | 7 | 2,004(0.35%)#30 | 83,187(0.01%)#1,678 |
| 31. | Houserville | 7 | 2,004(0.35%)#31 | 83,187(0.01%)#1,690 |
| 32. | Pottstown Borough | 6 | 2,004(0.30%)#32 | 83,187(0.01%)#1,725 |
| 33. | Nazareth Borough | 6 | 2,004(0.30%)#33 | 83,187(0.01%)#1,759 |
| 34. | Southmont Borough | 6 | 2,004(0.30%)#34 | 83,187(0.01%)#1,783 |
| 35. | Trevorton | 6 | 2,004(0.30%)#35 | 83,187(0.01%)#1,792 |
| 36. | St Vincent College | 6 | 2,004(0.30%)#36 | 83,187(0.01%)#1,794 |
| 37. | Tresckow | 6 | 2,004(0.30%)#37 | 83,187(0.01%)#1,800 |
| 38. | Villanova | 5 | 2,004(0.25%)#38 | 83,187(0.01%)#1,832 |
| 39. | Exton | 5 | 2,004(0.25%)#39 | 83,187(0.01%)#1,835 |
| 40. | California Borough | 5 | 2,004(0.25%)#40 | 83,187(0.01%)#1,840 |
| 41. | Beaver Borough | 5 | 2,004(0.25%)#41 | 83,187(0.01%)#1,843 |
| 42. | Wellsboro Borough | 5 | 2,004(0.25%)#42 | 83,187(0.01%)#1,848 |
| 43. | Canton Borough | 5 | 2,004(0.25%)#43 | 83,187(0.01%)#1,867 |
| 44. | Rose Valley Borough | 5 | 2,004(0.25%)#44 | 83,187(0.01%)#1,877 |
| 45. | Levittown | 4 | 2,004(0.20%)#45 | 83,187(0.00%)#1,890 |
| 46. | Willow Grove | 4 | 2,004(0.20%)#46 | 83,187(0.00%)#1,905 |
| 47. | Northwest Harborcreek | 4 | 2,004(0.20%)#47 | 83,187(0.00%)#1,912 |
| 48. | Martinsburg Borough | 4 | 2,004(0.20%)#48 | 83,187(0.00%)#1,937 |
| 49. | Susquehanna Depot Borough | 4 | 2,004(0.20%)#49 | 83,187(0.00%)#1,944 |
| 50. | Leetsdale Borough | 4 | 2,004(0.20%)#50 | 83,187(0.00%)#1,948 |
| 51. | Delaware Water Gap Borough | 4 | 2,004(0.20%)#51 | 83,187(0.00%)#1,954 |
| 52. | Marianne | 3 | 2,004(0.15%)#52 | 83,187(0.00%)#2,028 |
| 53. | Trumbauersville Borough | 3 | 2,004(0.15%)#53 | 83,187(0.00%)#2,031 |
| 54. | North Bend | 3 | 2,004(0.15%)#54 | 83,187(0.00%)#2,048 |
| 55. | Jamestown Borough | 2 | 2,004(0.10%)#55 | 83,187(0.00%)#2,101 |
| 56. | Deemston Borough | 2 | 2,004(0.10%)#56 | 83,187(0.00%)#2,102 |
| 57. | Ben Avon Heights Borough | 2 | 2,004(0.10%)#57 | 83,187(0.00%)#2,119 |
| 58. | Collingdale Borough | 1 | 2,004(0.05%)#58 | 83,187(0.00%)#2,134 |
| 59. | Rutledge Borough | 1 | 2,004(0.05%)#59 | 83,187(0.00%)#2,147 |
| 60. | Wheatland Borough | 1 | 2,004(0.05%)#60 | 83,187(0.00%)#2,155 |
Common Questions
What are the Top 10 Cities with the Most Immigrants from Netherlands in Pennsylvania?
Top 10 Cities with the Most Immigrants from Netherlands in Pennsylvania are:
#1
162
#2
83
#3
48
#4
48
#5
40
#6
38
#7
37
#8
25
#9
25
#10
24
What city has the Most Immigrants from Netherlands in Pennsylvania?
Philadelphia has the Most Immigrants from Netherlands in Pennsylvania with 162.
What is the Total Immigrants from Netherlands in the State of Pennsylvania?
Total Immigrants from Netherlands in Pennsylvania is 2,004.
What is the Total Immigrants from Netherlands in the United States?
Total Immigrants from Netherlands in the United States is 83,187.