Cities with the Most Immigrants from Malaysia in Pennsylvania
RELATED REPORTS & OPTIONS
Malaysia
Pennsylvania
Compare Cities
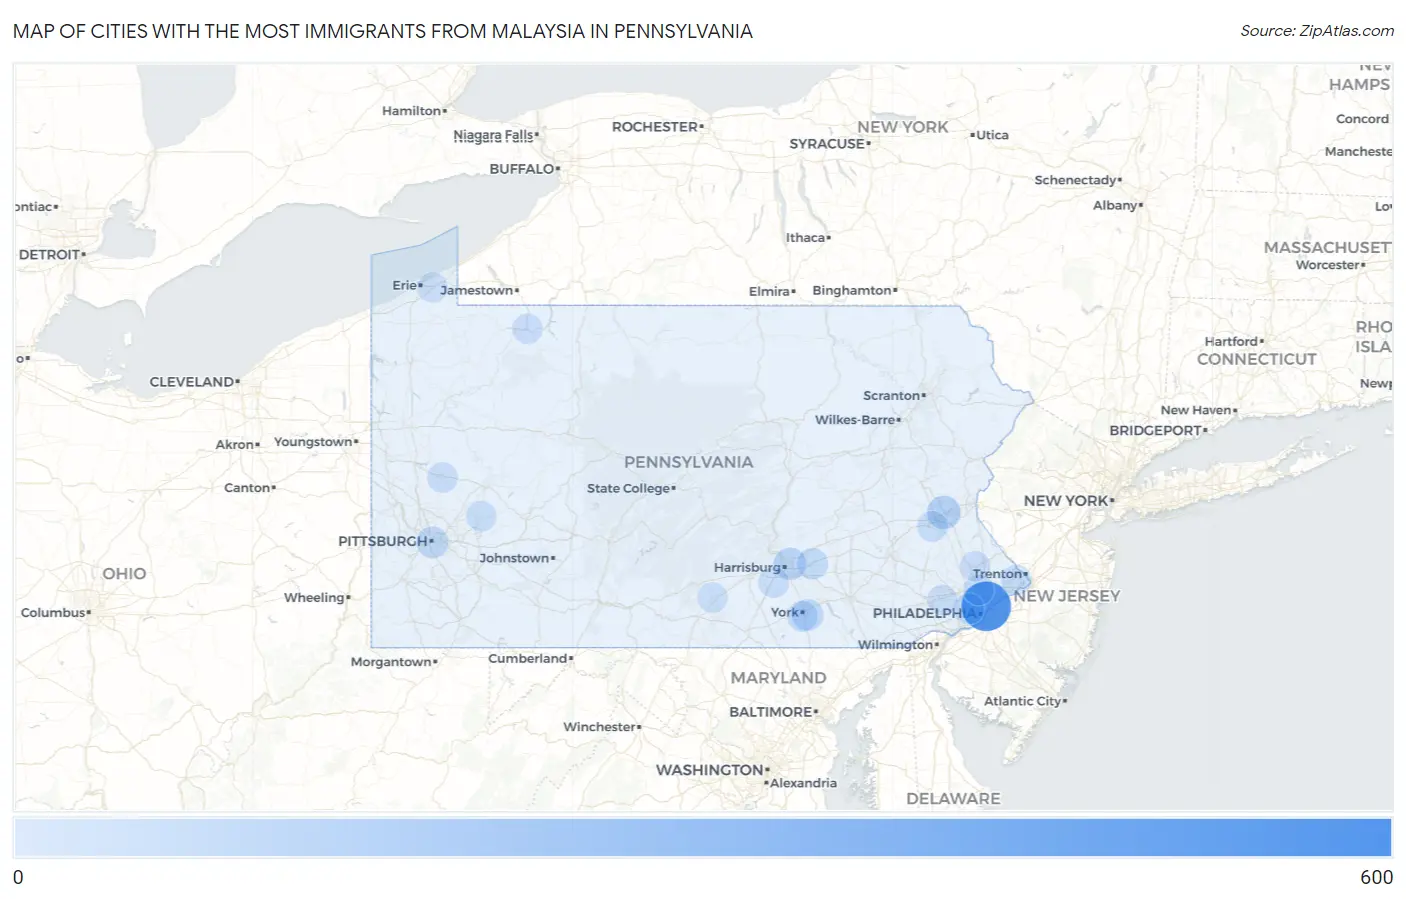
Map of Cities with the Most Immigrants from Malaysia in Pennsylvania
0
600

Cities with the Most Immigrants from Malaysia in Pennsylvania
| City | Malaysia | vs State | vs National | |
| 1. | Philadelphia | 545 | 1,902(28.65%)#1 | 82,574(0.66%)#15 |
| 2. | Fullerton | 88 | 1,902(4.63%)#2 | 82,574(0.11%)#155 |
| 3. | Progress | 61 | 1,902(3.21%)#3 | 82,574(0.07%)#240 |
| 4. | Pittsburgh | 48 | 1,902(2.52%)#4 | 82,574(0.06%)#303 |
| 5. | Queens Gate | 41 | 1,902(2.16%)#5 | 82,574(0.05%)#348 |
| 6. | Hershey | 31 | 1,902(1.63%)#6 | 82,574(0.04%)#461 |
| 7. | Fox Chapel Borough | 30 | 1,902(1.58%)#7 | 82,574(0.04%)#467 |
| 8. | Penn Wynne | 23 | 1,902(1.21%)#8 | 82,574(0.03%)#561 |
| 9. | Bala Cynwyd | 19 | 1,902(1.00%)#9 | 82,574(0.02%)#625 |
| 10. | Ancient Oaks | 18 | 1,902(0.95%)#10 | 82,574(0.02%)#652 |
| 11. | Grantley | 16 | 1,902(0.84%)#11 | 82,574(0.02%)#708 |
| 12. | Fairless Hills | 15 | 1,902(0.79%)#12 | 82,574(0.02%)#747 |
| 13. | Oreland | 14 | 1,902(0.74%)#13 | 82,574(0.02%)#787 |
| 14. | White Oak Borough | 12 | 1,902(0.63%)#14 | 82,574(0.01%)#873 |
| 15. | Messiah College | 12 | 1,902(0.63%)#15 | 82,574(0.01%)#879 |
| 16. | Butler | 11 | 1,902(0.58%)#16 | 82,574(0.01%)#911 |
| 17. | Lansdowne Borough | 11 | 1,902(0.58%)#17 | 82,574(0.01%)#913 |
| 18. | Carlisle Borough | 9 | 1,902(0.47%)#18 | 82,574(0.01%)#990 |
| 19. | Warren | 9 | 1,902(0.47%)#19 | 82,574(0.01%)#1,002 |
| 20. | Whitehall Borough | 8 | 1,902(0.42%)#20 | 82,574(0.01%)#1,037 |
| 21. | Paoli | 8 | 1,902(0.42%)#21 | 82,574(0.01%)#1,043 |
| 22. | Brittany Farms The Highlands | 7 | 1,902(0.37%)#22 | 82,574(0.01%)#1,089 |
| 23. | Churchill Borough | 6 | 1,902(0.32%)#23 | 82,574(0.01%)#1,128 |
| 24. | Dover Borough | 6 | 1,902(0.32%)#24 | 82,574(0.01%)#1,131 |
| 25. | North Vandergrift | 5 | 1,902(0.26%)#25 | 82,574(0.01%)#1,189 |
| 26. | Shippensburg University | 4 | 1,902(0.21%)#26 | 82,574(0.00%)#1,215 |
| 27. | Penn State Erie Behrend | 4 | 1,902(0.21%)#27 | 82,574(0.00%)#1,217 |
| 28. | Trumbauersville Borough | 3 | 1,902(0.16%)#28 | 82,574(0.00%)#1,243 |
| 29. | Sewickley Heights Borough | 2 | 1,902(0.11%)#29 | 82,574(0.00%)#1,279 |
| 30. | Laurel Run Borough | 2 | 1,902(0.11%)#30 | 82,574(0.00%)#1,282 |
Common Questions
What are the Top 10 Cities with the Most Immigrants from Malaysia in Pennsylvania?
Top 10 Cities with the Most Immigrants from Malaysia in Pennsylvania are:
#1
545
#2
88
#3
61
#4
48
#5
41
#6
31
#7
23
#8
18
#9
16
#10
15
What city has the Most Immigrants from Malaysia in Pennsylvania?
Philadelphia has the Most Immigrants from Malaysia in Pennsylvania with 545.
What is the Total Immigrants from Malaysia in the State of Pennsylvania?
Total Immigrants from Malaysia in Pennsylvania is 1,902.
What is the Total Immigrants from Malaysia in the United States?
Total Immigrants from Malaysia in the United States is 82,574.