Cities with the Most Immigrants from Iraq in Ohio
RELATED REPORTS & OPTIONS
Iraq
Ohio
Compare Cities
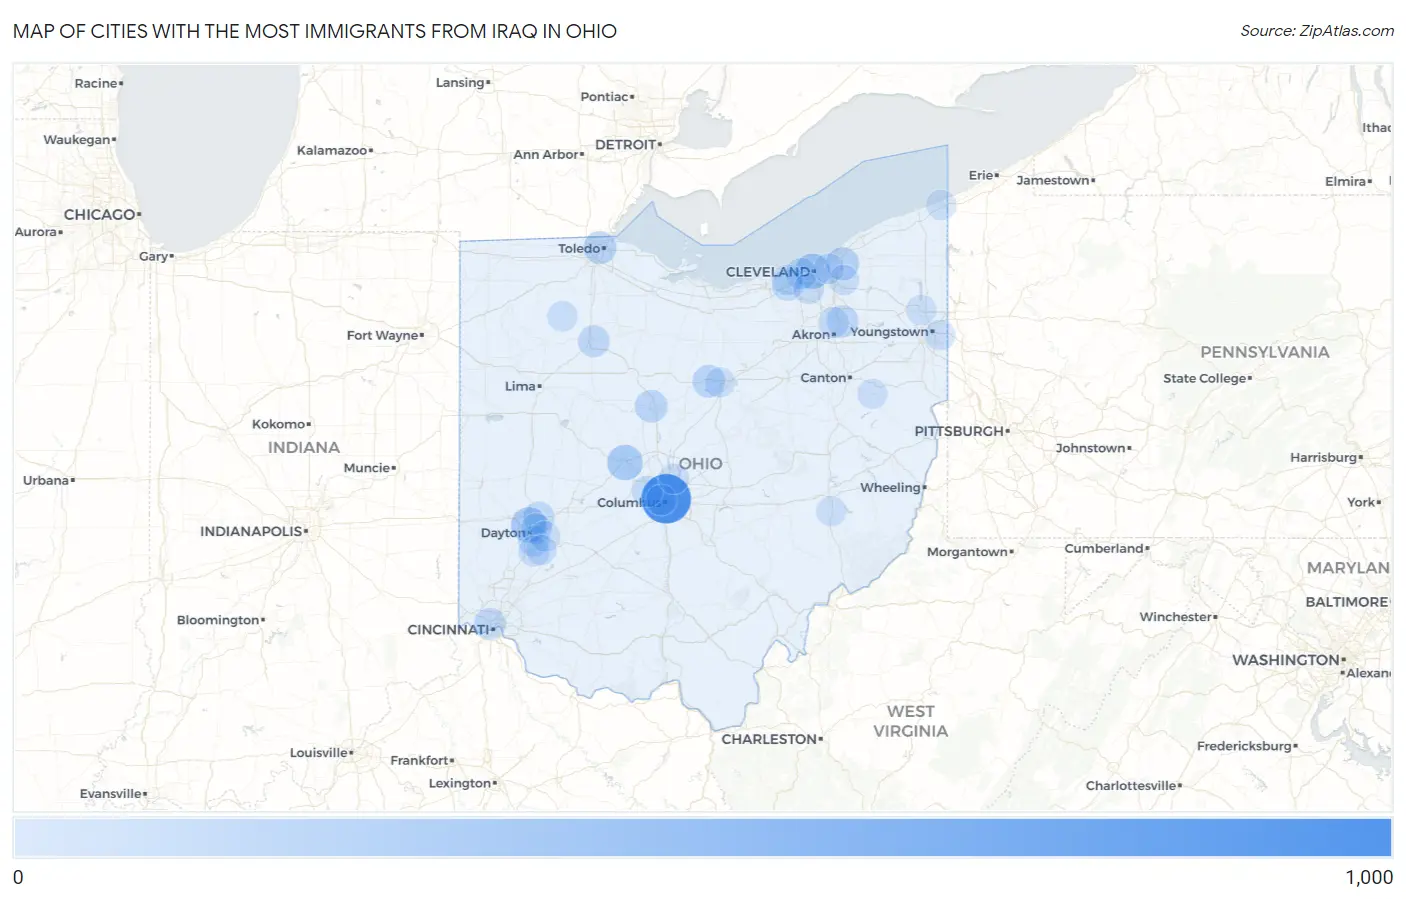
Map of Cities with the Most Immigrants from Iraq in Ohio
0
1,000
Cities with the Most Immigrants from Iraq in Ohio
| City | Iraq | vs State | vs National | |
| 1. | Columbus | 977 | 3,414(28.62%)#1 | 234,088(0.42%)#40 |
| 2. | Dayton | 256 | 3,414(7.50%)#2 | 234,088(0.11%)#135 |
| 3. | Cleveland | 251 | 3,414(7.35%)#3 | 234,088(0.11%)#140 |
| 4. | Marysville | 251 | 3,414(7.35%)#4 | 234,088(0.11%)#141 |
| 5. | Mayfield | 147 | 3,414(4.31%)#5 | 234,088(0.06%)#221 |
| 6. | Toledo | 129 | 3,414(3.78%)#6 | 234,088(0.06%)#241 |
| 7. | Ontario | 121 | 3,414(3.54%)#7 | 234,088(0.05%)#259 |
| 8. | Marion | 113 | 3,414(3.31%)#8 | 234,088(0.05%)#276 |
| 9. | Cincinnati | 89 | 3,414(2.61%)#9 | 234,088(0.04%)#323 |
| 10. | Stow | 87 | 3,414(2.55%)#10 | 234,088(0.04%)#330 |
| 11. | Findlay | 81 | 3,414(2.37%)#11 | 234,088(0.03%)#350 |
| 12. | Huber Heights | 71 | 3,414(2.08%)#12 | 234,088(0.03%)#383 |
| 13. | North Olmsted | 67 | 3,414(1.96%)#13 | 234,088(0.03%)#398 |
| 14. | Lakewood | 61 | 3,414(1.79%)#14 | 234,088(0.03%)#430 |
| 15. | Hilliard | 57 | 3,414(1.67%)#15 | 234,088(0.02%)#452 |
| 16. | Kettering | 52 | 3,414(1.52%)#16 | 234,088(0.02%)#485 |
| 17. | Riverside | 42 | 3,414(1.23%)#17 | 234,088(0.02%)#573 |
| 18. | Westlake | 35 | 3,414(1.03%)#18 | 234,088(0.01%)#631 |
| 19. | Parma | 31 | 3,414(0.91%)#19 | 234,088(0.01%)#667 |
| 20. | Grandview Heights | 31 | 3,414(0.91%)#20 | 234,088(0.01%)#674 |
| 21. | Cuyahoga Falls | 27 | 3,414(0.79%)#21 | 234,088(0.01%)#713 |
| 22. | Centerville | 25 | 3,414(0.73%)#22 | 234,088(0.01%)#743 |
| 23. | Campbell | 22 | 3,414(0.64%)#23 | 234,088(0.01%)#799 |
| 24. | Moreland Hills | 22 | 3,414(0.64%)#24 | 234,088(0.01%)#802 |
| 25. | Westerville | 20 | 3,414(0.59%)#25 | 234,088(0.01%)#826 |
| 26. | Beavercreek | 19 | 3,414(0.56%)#26 | 234,088(0.01%)#840 |
| 27. | Cleveland Heights | 12 | 3,414(0.35%)#27 | 234,088(0.01%)#980 |
| 28. | Deshler | 11 | 3,414(0.32%)#28 | 234,088(0.00%)#1,026 |
| 29. | Conneaut | 6 | 3,414(0.18%)#29 | 234,088(0.00%)#1,155 |
| 30. | Bellbrook | 6 | 3,414(0.18%)#30 | 234,088(0.00%)#1,156 |
| 31. | Howland Center | 6 | 3,414(0.18%)#31 | 234,088(0.00%)#1,158 |
| 32. | Mansfield | 5 | 3,414(0.15%)#32 | 234,088(0.00%)#1,169 |
| 33. | Malvern | 3 | 3,414(0.09%)#33 | 234,088(0.00%)#1,219 |
| 34. | Pleasant City | 2 | 3,414(0.06%)#34 | 234,088(0.00%)#1,233 |
Common Questions
What are the Top 10 Cities with the Most Immigrants from Iraq in Ohio?
Top 10 Cities with the Most Immigrants from Iraq in Ohio are:
#1
977
#2
256
#3
251
#4
251
#5
147
#6
129
#7
121
#8
113
#9
89
#10
87
What city has the Most Immigrants from Iraq in Ohio?
Columbus has the Most Immigrants from Iraq in Ohio with 977.
What is the Total Immigrants from Iraq in the State of Ohio?
Total Immigrants from Iraq in Ohio is 3,414.
What is the Total Immigrants from Iraq in the United States?
Total Immigrants from Iraq in the United States is 234,088.