Cities with the Most Immigrants from Ethiopia in Pennsylvania
RELATED REPORTS & OPTIONS
Ethiopia
Pennsylvania
Compare Cities
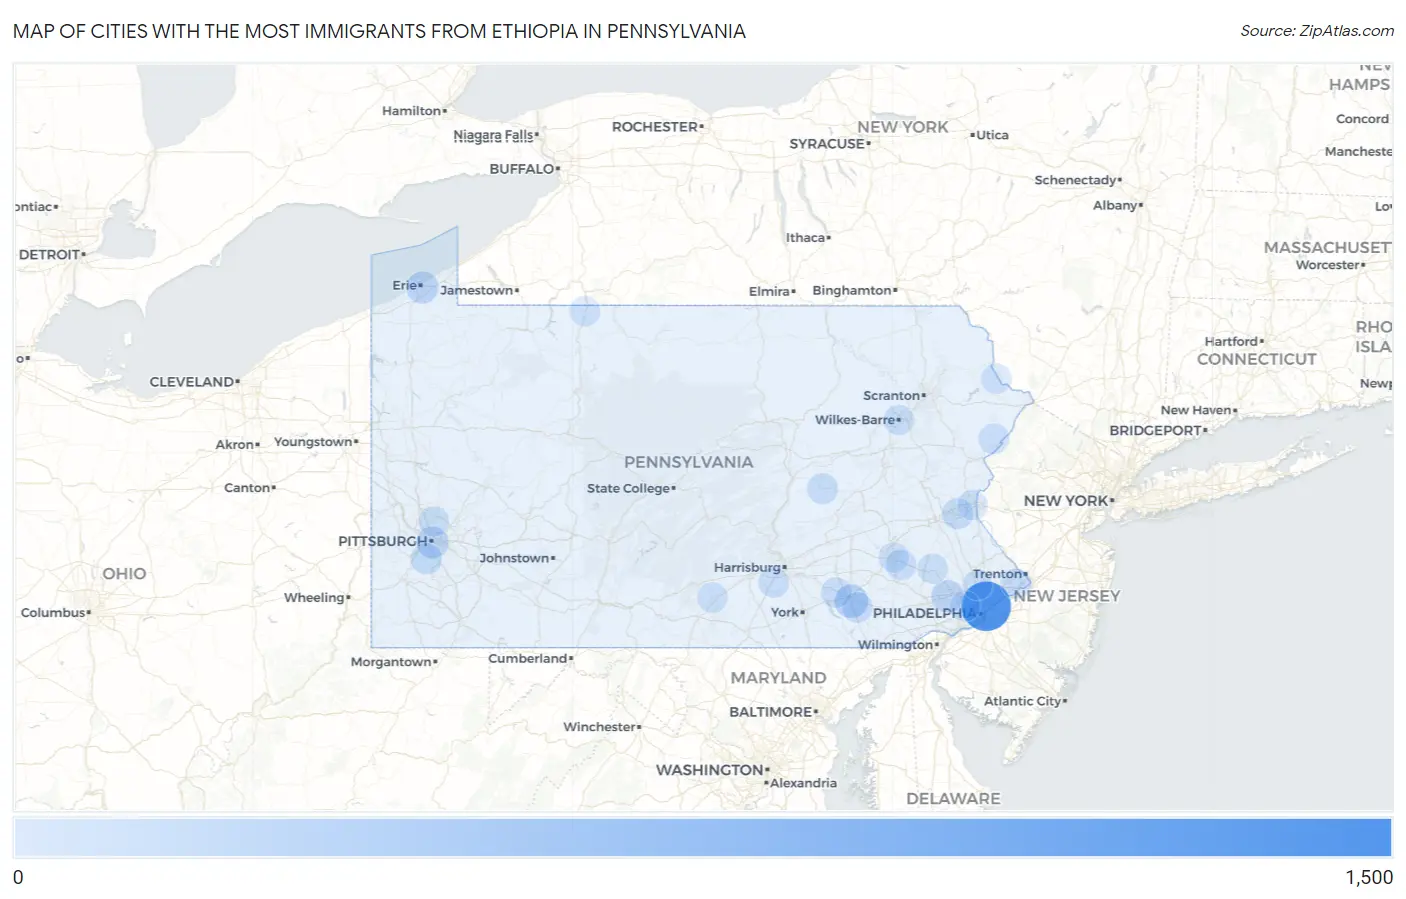
Map of Cities with the Most Immigrants from Ethiopia in Pennsylvania
0
1,500
Cities with the Most Immigrants from Ethiopia in Pennsylvania
| City | Ethiopia | vs State | vs National | |
| 1. | Philadelphia | 1,404 | 4,658(30.14%)#1 | 275,476(0.51%)#36 |
| 2. | Lancaster | 229 | 4,658(4.92%)#2 | 275,476(0.08%)#188 |
| 3. | Elizabethtown Borough | 157 | 4,658(3.37%)#3 | 275,476(0.06%)#262 |
| 4. | Erie | 137 | 4,658(2.94%)#4 | 275,476(0.05%)#295 |
| 5. | Pittsburgh | 134 | 4,658(2.88%)#5 | 275,476(0.05%)#299 |
| 6. | Chesterbrook | 133 | 4,658(2.86%)#6 | 275,476(0.05%)#303 |
| 7. | Chalfont Borough | 129 | 4,658(2.77%)#7 | 275,476(0.05%)#307 |
| 8. | Yeadon Borough | 97 | 4,658(2.08%)#8 | 275,476(0.04%)#394 |
| 9. | Edwardsville Borough | 75 | 4,658(1.61%)#9 | 275,476(0.03%)#463 |
| 10. | Bethel Park | 71 | 4,658(1.52%)#10 | 275,476(0.03%)#473 |
| 11. | Bethlehem | 60 | 4,658(1.29%)#11 | 275,476(0.02%)#525 |
| 12. | East Lansdowne Borough | 56 | 4,658(1.20%)#12 | 275,476(0.02%)#561 |
| 13. | Wyomissing Borough | 52 | 4,658(1.12%)#13 | 275,476(0.02%)#581 |
| 14. | Shamokin | 52 | 4,658(1.12%)#14 | 275,476(0.02%)#584 |
| 15. | Mount Joy Borough | 38 | 4,658(0.82%)#15 | 275,476(0.01%)#693 |
| 16. | Lampeter | 34 | 4,658(0.73%)#16 | 275,476(0.01%)#747 |
| 17. | Adamstown Borough | 29 | 4,658(0.62%)#17 | 275,476(0.01%)#812 |
| 18. | Shenandoah Borough | 28 | 4,658(0.60%)#18 | 275,476(0.01%)#828 |
| 19. | Millbourne Borough | 28 | 4,658(0.60%)#19 | 275,476(0.01%)#829 |
| 20. | Shillington Borough | 26 | 4,658(0.56%)#20 | 275,476(0.01%)#858 |
| 21. | Gibraltar | 25 | 4,658(0.54%)#21 | 275,476(0.01%)#868 |
| 22. | Saw Creek | 24 | 4,658(0.52%)#22 | 275,476(0.01%)#886 |
| 23. | Allison Park | 18 | 4,658(0.39%)#23 | 275,476(0.01%)#986 |
| 24. | Levittown | 16 | 4,658(0.34%)#24 | 275,476(0.01%)#1,025 |
| 25. | Wilkes Barre | 13 | 4,658(0.28%)#25 | 275,476(0.00%)#1,100 |
| 26. | Messiah College | 13 | 4,658(0.28%)#26 | 275,476(0.00%)#1,119 |
| 27. | Salunga | 12 | 4,658(0.26%)#27 | 275,476(0.00%)#1,146 |
| 28. | Ardmore | 11 | 4,658(0.24%)#28 | 275,476(0.00%)#1,174 |
| 29. | Sanatoga | 10 | 4,658(0.21%)#29 | 275,476(0.00%)#1,194 |
| 30. | Masthope | 10 | 4,658(0.21%)#30 | 275,476(0.00%)#1,200 |
| 31. | State College Borough | 9 | 4,658(0.19%)#31 | 275,476(0.00%)#1,215 |
| 32. | Carlisle Borough | 9 | 4,658(0.19%)#32 | 275,476(0.00%)#1,228 |
| 33. | Darby Borough | 9 | 4,658(0.19%)#33 | 275,476(0.00%)#1,238 |
| 34. | Shippensburg University | 9 | 4,658(0.19%)#34 | 275,476(0.00%)#1,249 |
| 35. | Norristown Borough | 8 | 4,658(0.17%)#35 | 275,476(0.00%)#1,266 |
| 36. | Bradford | 8 | 4,658(0.17%)#36 | 275,476(0.00%)#1,277 |
| 37. | Shiremanstown Borough | 8 | 4,658(0.17%)#37 | 275,476(0.00%)#1,283 |
| 38. | Easton | 7 | 4,658(0.15%)#38 | 275,476(0.00%)#1,299 |
| 39. | Fort Washington | 7 | 4,658(0.15%)#39 | 275,476(0.00%)#1,310 |
| 40. | Mount Wolf Borough | 6 | 4,658(0.13%)#40 | 275,476(0.00%)#1,347 |
| 41. | Reading | 5 | 4,658(0.11%)#41 | 275,476(0.00%)#1,355 |
| 42. | Emsworth Borough | 5 | 4,658(0.11%)#42 | 275,476(0.00%)#1,378 |
| 43. | East Prospect Borough | 4 | 4,658(0.09%)#43 | 275,476(0.00%)#1,411 |
| 44. | Newburg Borough Cumberland County | 3 | 4,658(0.06%)#44 | 275,476(0.00%)#1,435 |
| 45. | Williamstown Borough | 2 | 4,658(0.04%)#45 | 275,476(0.00%)#1,458 |
Common Questions
What are the Top 10 Cities with the Most Immigrants from Ethiopia in Pennsylvania?
Top 10 Cities with the Most Immigrants from Ethiopia in Pennsylvania are:
#1
1,404
#2
229
#3
137
#4
134
#5
133
#6
71
#7
60
#8
52
#9
34
#10
25
What city has the Most Immigrants from Ethiopia in Pennsylvania?
Philadelphia has the Most Immigrants from Ethiopia in Pennsylvania with 1,404.
What is the Total Immigrants from Ethiopia in the State of Pennsylvania?
Total Immigrants from Ethiopia in Pennsylvania is 4,658.
What is the Total Immigrants from Ethiopia in the United States?
Total Immigrants from Ethiopia in the United States is 275,476.