States with the Most Immigrants from Ethiopia
RELATED REPORTS & OPTIONS
Ethiopia
United States
Compare States
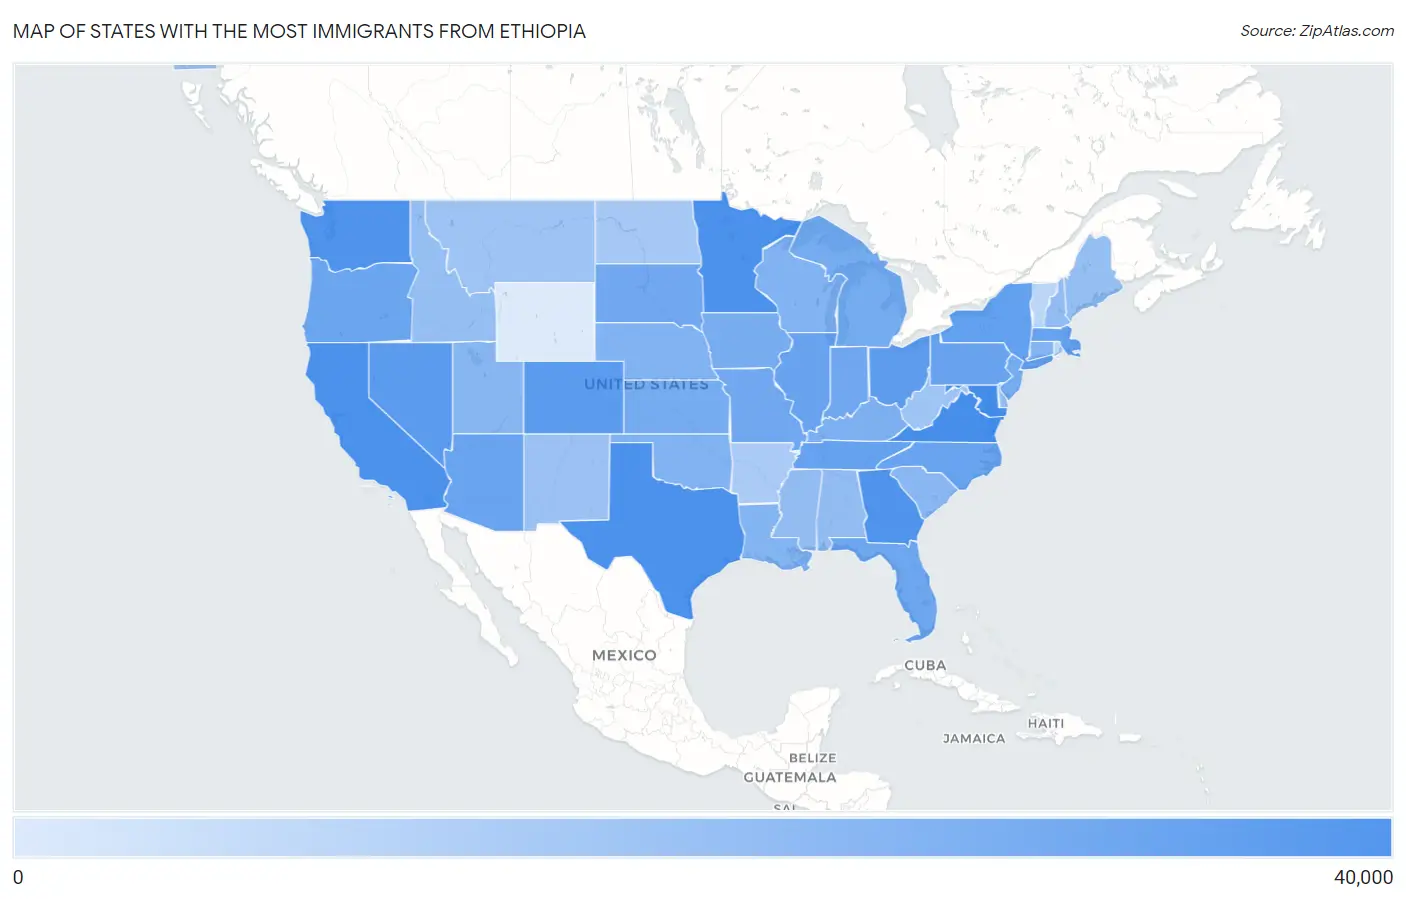
Map of States with the Most Immigrants from Ethiopia
0
40,000
States with the Most Immigrants from Ethiopia in the United States
| State | Ethiopia | vs State Median | vs National | |
| 1. | Virginia | 32,082 | 1,880 (+30.2k) | 275,476(11.65%) |
| 2. | Maryland | 30,870 | 1,880 (+29.0k) | 275,476(11.21%) |
| 3. | Texas | 24,705 | 1,880 (+22.8k) | 275,476(8.97%) |
| 4. | California | 24,635 | 1,880 (+22.8k) | 275,476(8.94%) |
| 5. | Minnesota | 24,630 | 1,880 (+22.8k) | 275,476(8.94%) |
| 6. | Washington | 17,938 | 1,880 (+16.1k) | 275,476(6.51%) |
| 7. | Georgia | 17,643 | 1,880 (+15.8k) | 275,476(6.40%) |
| 8. | Nevada | 10,683 | 1,880 (+8.80k) | 275,476(3.88%) |
| 9. | Colorado | 10,372 | 1,880 (+8.49k) | 275,476(3.77%) |
| 10. | Ohio | 8,380 | 1,880 (+6.50k) | 275,476(3.04%) |
| 11. | New York | 6,029 | 1,880 (+4.15k) | 275,476(2.19%) |
| 12. | Massachusetts | 5,467 | 1,880 (+3.59k) | 275,476(1.98%) |
| 13. | Tennessee | 5,265 | 1,880 (+3.39k) | 275,476(1.91%) |
| 14. | Illinois | 4,775 | 1,880 (+2.90k) | 275,476(1.73%) |
| 15. | Pennsylvania | 4,658 | 1,880 (+2.78k) | 275,476(1.69%) |
| 16. | North Carolina | 4,296 | 1,880 (+2.42k) | 275,476(1.56%) |
| 17. | Arizona | 3,880 | 1,880 (+2.00k) | 275,476(1.41%) |
| 18. | Oregon | 3,555 | 1,880 (+1.68k) | 275,476(1.29%) |
| 19. | Florida | 3,129 | 1,880 (+1.25k) | 275,476(1.14%) |
| 20. | Missouri | 2,751 | 1,880 (+872) | 275,476(1.00%) |
| 21. | Indiana | 2,532 | 1,880 (+652) | 275,476(0.92%) |
| 22. | South Dakota | 2,512 | 1,880 (+632) | 275,476(0.91%) |
| 23. | New Jersey | 2,083 | 1,880 (+204) | 275,476(0.76%) |
| 24. | Michigan | 1,985 | 1,880 (+106) | 275,476(0.72%) |
| 25. | Kansas | 1,901 | 1,880 (+21.5) | 275,476(0.69%) |
| 26. | Iowa | 1,858 | 1,880 (-21.5) | 275,476(0.67%) |
| 27. | Kentucky | 1,372 | 1,880 (-508) | 275,476(0.50%) |
| 28. | Wisconsin | 1,080 | 1,880 (-800) | 275,476(0.39%) |
| 29. | Nebraska | 1,021 | 1,880 (-858) | 275,476(0.37%) |
| 30. | Oklahoma | 983 | 1,880 (-896) | 275,476(0.36%) |
| 31. | Connecticut | 956 | 1,880 (-924) | 275,476(0.35%) |
| 32. | Louisiana | 892 | 1,880 (-988) | 275,476(0.32%) |
| 33. | Utah | 692 | 1,880 (-1.19k) | 275,476(0.25%) |
| 34. | South Carolina | 594 | 1,880 (-1.29k) | 275,476(0.22%) |
| 35. | New Hampshire | 385 | 1,880 (-1.49k) | 275,476(0.14%) |
| 36. | Alabama | 319 | 1,880 (-1.56k) | 275,476(0.12%) |
| 37. | Mississippi | 314 | 1,880 (-1.57k) | 275,476(0.11%) |
| 38. | Idaho | 295 | 1,880 (-1.58k) | 275,476(0.11%) |
| 39. | Maine | 286 | 1,880 (-1.59k) | 275,476(0.10%) |
| 40. | Delaware | 269 | 1,880 (-1.61k) | 275,476(0.10%) |
| 41. | New Mexico | 205 | 1,880 (-1.67k) | 275,476(0.07%) |
| 42. | West Virginia | 178 | 1,880 (-1.70k) | 275,476(0.06%) |
| 43. | Montana | 162 | 1,880 (-1.72k) | 275,476(0.06%) |
| 44. | Alaska | 116 | 1,880 (-1.76k) | 275,476(0.04%) |
| 45. | North Dakota | 115 | 1,880 (-1.76k) | 275,476(0.04%) |
| 46. | Arkansas | 80 | 1,880 (-1.80k) | 275,476(0.03%) |
| 47. | Vermont | 33 | 1,880 (-1.85k) | 275,476(0.01%) |
| 48. | Rhode Island | 25 | 1,880 (-1.85k) | 275,476(0.01%) |
| 49. | Hawaii | 17 | 1,880 (-1.86k) | 275,476(0.01%) |
| 50. | Wyoming | 3 | 1,880 (-1.88k) | 275,476(0.00%) |
1
Common Questions
What are the Top 10 States with the Most Immigrants from Ethiopia in the United States?
Top 10 States with the Most Immigrants from Ethiopia in the United States are:
#1
32,082
#2
30,870
#3
24,705
#4
24,635
#5
24,630
#6
17,938
#7
17,643
#8
10,683
#9
10,372
#10
8,380
What state has the Most Immigrants from Ethiopia in the United States?
Virginia has the Most Immigrants from Ethiopia in the United States with 32,082.
What is the Total Immigrants from Ethiopia in the United States?
Total Immigrants from Ethiopia in the United States is 275,476.