Cities with the Most Immigrants from Ethiopia in Georgia
RELATED REPORTS & OPTIONS
Ethiopia
Georgia
Compare Cities
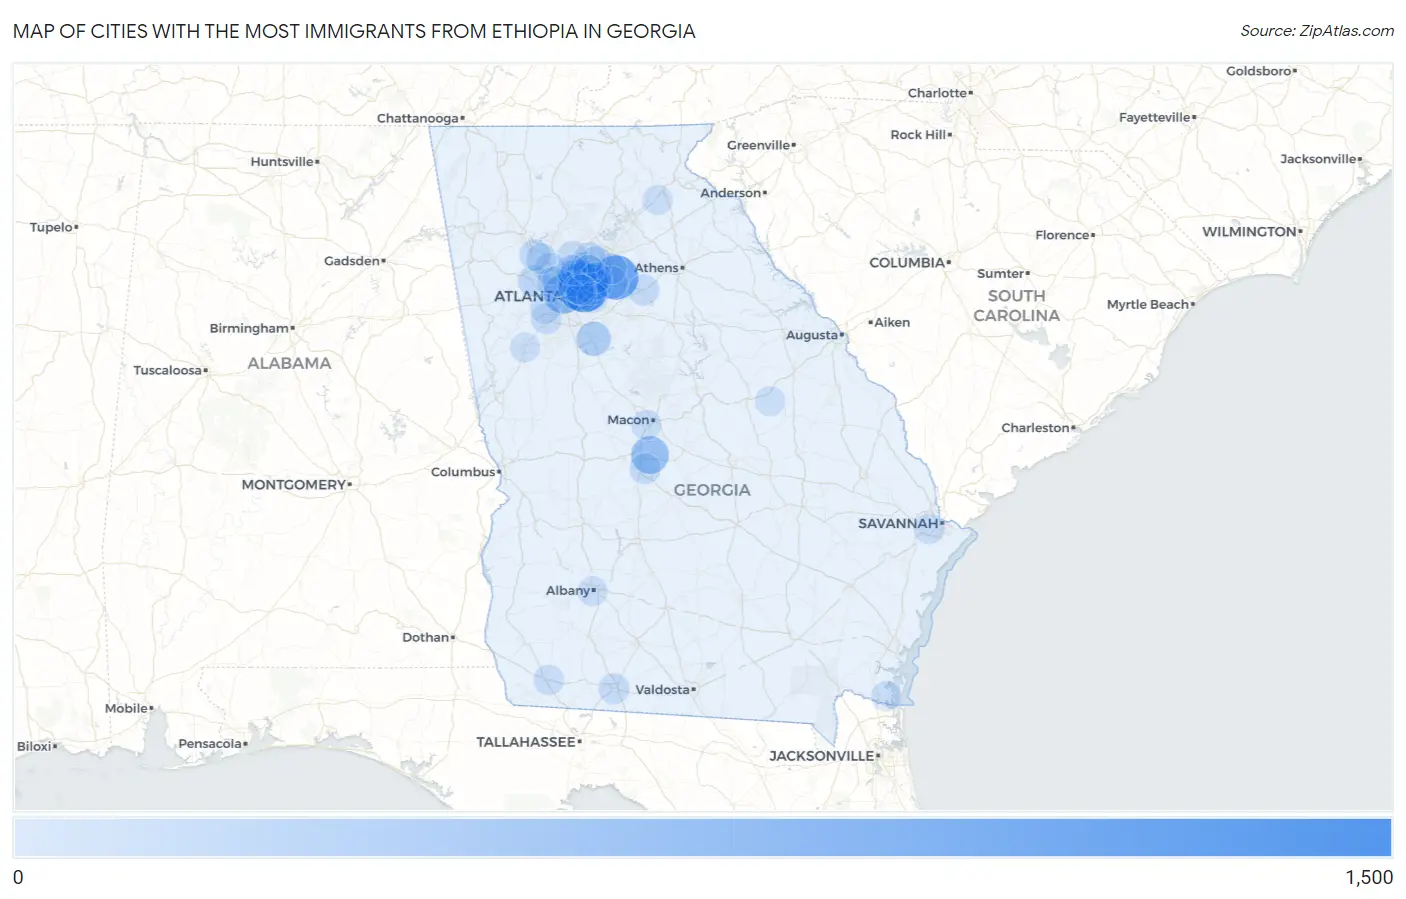
Map of Cities with the Most Immigrants from Ethiopia in Georgia
0
1,500
Cities with the Most Immigrants from Ethiopia in Georgia
| City | Ethiopia | vs State | vs National | |
| 1. | Clarkston | 1,472 | 17,643(8.34%)#1 | 275,476(0.53%)#34 |
| 2. | Grayson | 1,063 | 17,643(6.03%)#2 | 275,476(0.39%)#44 |
| 3. | Atlanta | 707 | 17,643(4.01%)#3 | 275,476(0.26%)#66 |
| 4. | Tucker | 649 | 17,643(3.68%)#4 | 275,476(0.24%)#79 |
| 5. | Chamblee | 589 | 17,643(3.34%)#5 | 275,476(0.21%)#86 |
| 6. | Warner Robins | 554 | 17,643(3.14%)#6 | 275,476(0.20%)#92 |
| 7. | Mcdonough | 317 | 17,643(1.80%)#7 | 275,476(0.12%)#150 |
| 8. | Decatur | 252 | 17,643(1.43%)#8 | 275,476(0.09%)#176 |
| 9. | Snellville | 202 | 17,643(1.14%)#9 | 275,476(0.07%)#208 |
| 10. | Brookhaven | 178 | 17,643(1.01%)#10 | 275,476(0.06%)#236 |
| 11. | Duluth | 150 | 17,643(0.85%)#11 | 275,476(0.05%)#275 |
| 12. | Stone Mountain | 147 | 17,643(0.83%)#12 | 275,476(0.05%)#280 |
| 13. | Mountain Park | 134 | 17,643(0.76%)#13 | 275,476(0.05%)#300 |
| 14. | Powder Springs | 121 | 17,643(0.69%)#14 | 275,476(0.04%)#321 |
| 15. | Doraville | 84 | 17,643(0.48%)#15 | 275,476(0.03%)#424 |
| 16. | Marietta | 83 | 17,643(0.47%)#16 | 275,476(0.03%)#426 |
| 17. | Acworth | 80 | 17,643(0.45%)#17 | 275,476(0.03%)#440 |
| 18. | North Druid Hills | 76 | 17,643(0.43%)#18 | 275,476(0.03%)#455 |
| 19. | Perry | 74 | 17,643(0.42%)#19 | 275,476(0.03%)#464 |
| 20. | Monroe | 66 | 17,643(0.37%)#20 | 275,476(0.02%)#497 |
| 21. | Smyrna | 61 | 17,643(0.35%)#21 | 275,476(0.02%)#516 |
| 22. | Dunwoody | 61 | 17,643(0.35%)#22 | 275,476(0.02%)#518 |
| 23. | Peachtree Corners | 58 | 17,643(0.33%)#23 | 275,476(0.02%)#539 |
| 24. | Lawrenceville | 58 | 17,643(0.33%)#24 | 275,476(0.02%)#541 |
| 25. | Thomasville | 58 | 17,643(0.33%)#25 | 275,476(0.02%)#542 |
| 26. | Kennesaw | 56 | 17,643(0.32%)#26 | 275,476(0.02%)#558 |
| 27. | Vinings | 55 | 17,643(0.31%)#27 | 275,476(0.02%)#565 |
| 28. | Belvedere Park | 49 | 17,643(0.28%)#28 | 275,476(0.02%)#604 |
| 29. | Johns Creek | 46 | 17,643(0.26%)#29 | 275,476(0.02%)#620 |
| 30. | Roswell | 41 | 17,643(0.23%)#30 | 275,476(0.01%)#662 |
| 31. | Lilburn | 41 | 17,643(0.23%)#31 | 275,476(0.01%)#666 |
| 32. | Union City | 35 | 17,643(0.20%)#32 | 275,476(0.01%)#730 |
| 33. | Sandy Springs | 34 | 17,643(0.19%)#33 | 275,476(0.01%)#738 |
| 34. | Athens-Clarke County Unified Government (Balance) | 33 | 17,643(0.19%)#34 | 275,476(0.01%)#749 |
| 35. | Norcross | 33 | 17,643(0.19%)#35 | 275,476(0.01%)#758 |
| 36. | Redan | 31 | 17,643(0.18%)#36 | 275,476(0.01%)#777 |
| 37. | North Decatur | 30 | 17,643(0.17%)#37 | 275,476(0.01%)#795 |
| 38. | Scottdale | 28 | 17,643(0.16%)#38 | 275,476(0.01%)#823 |
| 39. | Bainbridge | 23 | 17,643(0.13%)#39 | 275,476(0.01%)#900 |
| 40. | Savannah | 21 | 17,643(0.12%)#40 | 275,476(0.01%)#924 |
| 41. | Macon Bibb County | 16 | 17,643(0.09%)#41 | 275,476(0.01%)#1,019 |
| 42. | Kennesaw State University | 13 | 17,643(0.07%)#42 | 275,476(0.00%)#1,117 |
| 43. | Newnan | 10 | 17,643(0.06%)#43 | 275,476(0.00%)#1,187 |
| 44. | Davisboro | 10 | 17,643(0.06%)#44 | 275,476(0.00%)#1,198 |
| 45. | Augusta-Richmond County Consolidated Government (Balance) | 8 | 17,643(0.05%)#45 | 275,476(0.00%)#1,254 |
| 46. | South Fulton | 8 | 17,643(0.05%)#46 | 275,476(0.00%)#1,256 |
| 47. | Raoul | 8 | 17,643(0.05%)#47 | 275,476(0.00%)#1,281 |
| 48. | Albany | 5 | 17,643(0.03%)#48 | 275,476(0.00%)#1,358 |
| 49. | St Marys | 1 | 17,643(0.01%)#49 | 275,476(0.00%)#1,477 |
Common Questions
What are the Top 10 Cities with the Most Immigrants from Ethiopia in Georgia?
Top 10 Cities with the Most Immigrants from Ethiopia in Georgia are:
#1
1,472
#2
1,063
#3
707
#4
649
#5
589
#6
554
#7
317
#8
252
#9
202
#10
178
What city has the Most Immigrants from Ethiopia in Georgia?
Clarkston has the Most Immigrants from Ethiopia in Georgia with 1,472.
What is the Total Immigrants from Ethiopia in the State of Georgia?
Total Immigrants from Ethiopia in Georgia is 17,643.
What is the Total Immigrants from Ethiopia in the United States?
Total Immigrants from Ethiopia in the United States is 275,476.