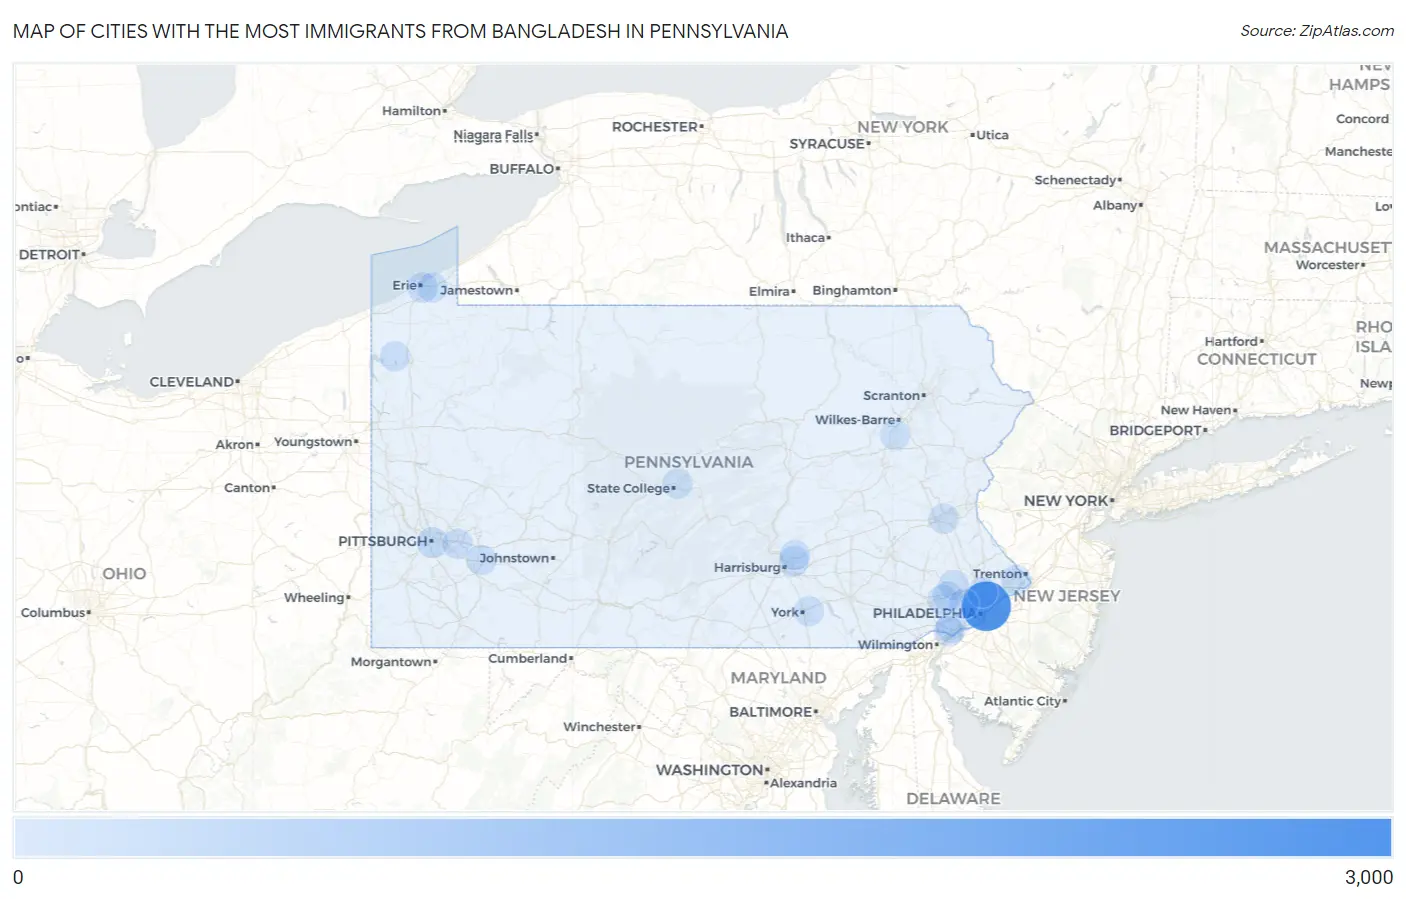
Cities with the Most Immigrants from Bangladesh in Pennsylvania
RELATED REPORTS & OPTIONS
Bangladesh
Pennsylvania
Compare Cities
Map of Cities with the Most Immigrants from Bangladesh in Pennsylvania
0
3,000

Cities with the Most Immigrants from Bangladesh in Pennsylvania
| City | Bangladesh | vs State | vs National | |
| 1. | Philadelphia | 2,914 | 8,772(33.22%)#1 | 271,479(1.07%)#8 |
| 2. | Lansdale Borough | 931 | 8,772(10.61%)#2 | 271,479(0.34%)#15 |
| 3. | Millbourne Borough | 235 | 8,772(2.68%)#3 | 271,479(0.09%)#121 |
| 4. | Hatfield Borough | 206 | 8,772(2.35%)#4 | 271,479(0.08%)#145 |
| 5. | Pittsburgh | 131 | 8,772(1.49%)#5 | 271,479(0.05%)#238 |
| 6. | Baldwin Borough | 112 | 8,772(1.28%)#6 | 271,479(0.04%)#280 |
| 7. | Village Green Green Ridge | 84 | 8,772(0.96%)#7 | 271,479(0.03%)#376 |
| 8. | West York Borough | 78 | 8,772(0.89%)#8 | 271,479(0.03%)#403 |
| 9. | Colonial Park | 68 | 8,772(0.78%)#9 | 271,479(0.03%)#449 |
| 10. | Fairless Hills | 62 | 8,772(0.71%)#10 | 271,479(0.02%)#478 |
| 11. | Erie | 56 | 8,772(0.64%)#11 | 271,479(0.02%)#528 |
| 12. | Clifton Heights Borough | 55 | 8,772(0.63%)#12 | 271,479(0.02%)#548 |
| 13. | Boothwyn | 48 | 8,772(0.55%)#13 | 271,479(0.02%)#597 |
| 14. | East Lansdowne Borough | 43 | 8,772(0.49%)#14 | 271,479(0.02%)#643 |
| 15. | Monroeville | 40 | 8,772(0.46%)#15 | 271,479(0.01%)#665 |
| 16. | Wyncote | 37 | 8,772(0.42%)#16 | 271,479(0.01%)#699 |
| 17. | Folcroft Borough | 30 | 8,772(0.34%)#17 | 271,479(0.01%)#786 |
| 18. | State College Borough | 26 | 8,772(0.30%)#18 | 271,479(0.01%)#830 |
| 19. | Valley View Cdp York County | 25 | 8,772(0.28%)#19 | 271,479(0.01%)#858 |
| 20. | Lewisburg Borough | 24 | 8,772(0.27%)#20 | 271,479(0.01%)#879 |
| 21. | Morton Borough | 22 | 8,772(0.25%)#21 | 271,479(0.01%)#910 |
| 22. | Houserville | 21 | 8,772(0.24%)#22 | 271,479(0.01%)#930 |
| 23. | Allentown | 19 | 8,772(0.22%)#23 | 271,479(0.01%)#949 |
| 24. | Paoli | 19 | 8,772(0.22%)#24 | 271,479(0.01%)#968 |
| 25. | Mechanicsburg Borough | 17 | 8,772(0.19%)#25 | 271,479(0.01%)#1,014 |
| 26. | Trooper | 17 | 8,772(0.19%)#26 | 271,479(0.01%)#1,020 |
| 27. | Mountain Top | 15 | 8,772(0.17%)#27 | 271,479(0.01%)#1,066 |
| 28. | Honey Brook Borough | 15 | 8,772(0.17%)#28 | 271,479(0.01%)#1,070 |
| 29. | Rutledge Borough | 15 | 8,772(0.17%)#29 | 271,479(0.01%)#1,071 |
| 30. | Chesterbrook | 13 | 8,772(0.15%)#30 | 271,479(0.00%)#1,118 |
| 31. | East York | 12 | 8,772(0.14%)#31 | 271,479(0.00%)#1,146 |
| 32. | Linglestown | 12 | 8,772(0.14%)#32 | 271,479(0.00%)#1,149 |
| 33. | Harmonsburg | 12 | 8,772(0.14%)#33 | 271,479(0.00%)#1,156 |
| 34. | Bryn Mawr | 10 | 8,772(0.11%)#34 | 271,479(0.00%)#1,197 |
| 35. | Fleetwood Borough | 8 | 8,772(0.09%)#35 | 271,479(0.00%)#1,242 |
| 36. | Greensburg | 7 | 8,772(0.08%)#36 | 271,479(0.00%)#1,254 |
| 37. | Aspinwall Borough | 7 | 8,772(0.08%)#37 | 271,479(0.00%)#1,262 |
| 38. | Langhorne Manor Borough | 5 | 8,772(0.06%)#38 | 271,479(0.00%)#1,313 |
| 39. | Ivyland Borough | 5 | 8,772(0.06%)#39 | 271,479(0.00%)#1,315 |
| 40. | South Coatesville Borough | 4 | 8,772(0.05%)#40 | 271,479(0.00%)#1,333 |
| 41. | Penn State Erie Behrend | 3 | 8,772(0.03%)#41 | 271,479(0.00%)#1,346 |
Common Questions
What are the Top 10 Cities with the Most Immigrants from Bangladesh in Pennsylvania?
Top 10 Cities with the Most Immigrants from Bangladesh in Pennsylvania are:
#1
2,914
#2
131
#3
84
#4
68
#5
62
#6
56
#7
48
#8
40
#9
37
#10
21
What city has the Most Immigrants from Bangladesh in Pennsylvania?
Philadelphia has the Most Immigrants from Bangladesh in Pennsylvania with 2,914.
What is the Total Immigrants from Bangladesh in the State of Pennsylvania?
Total Immigrants from Bangladesh in Pennsylvania is 8,772.
What is the Total Immigrants from Bangladesh in the United States?
Total Immigrants from Bangladesh in the United States is 271,479.