Cities with the Highest Percentage of Immigrants from Sri Lanka in Virginia
RELATED REPORTS & OPTIONS
Sri Lanka
Virginia
Compare Cities
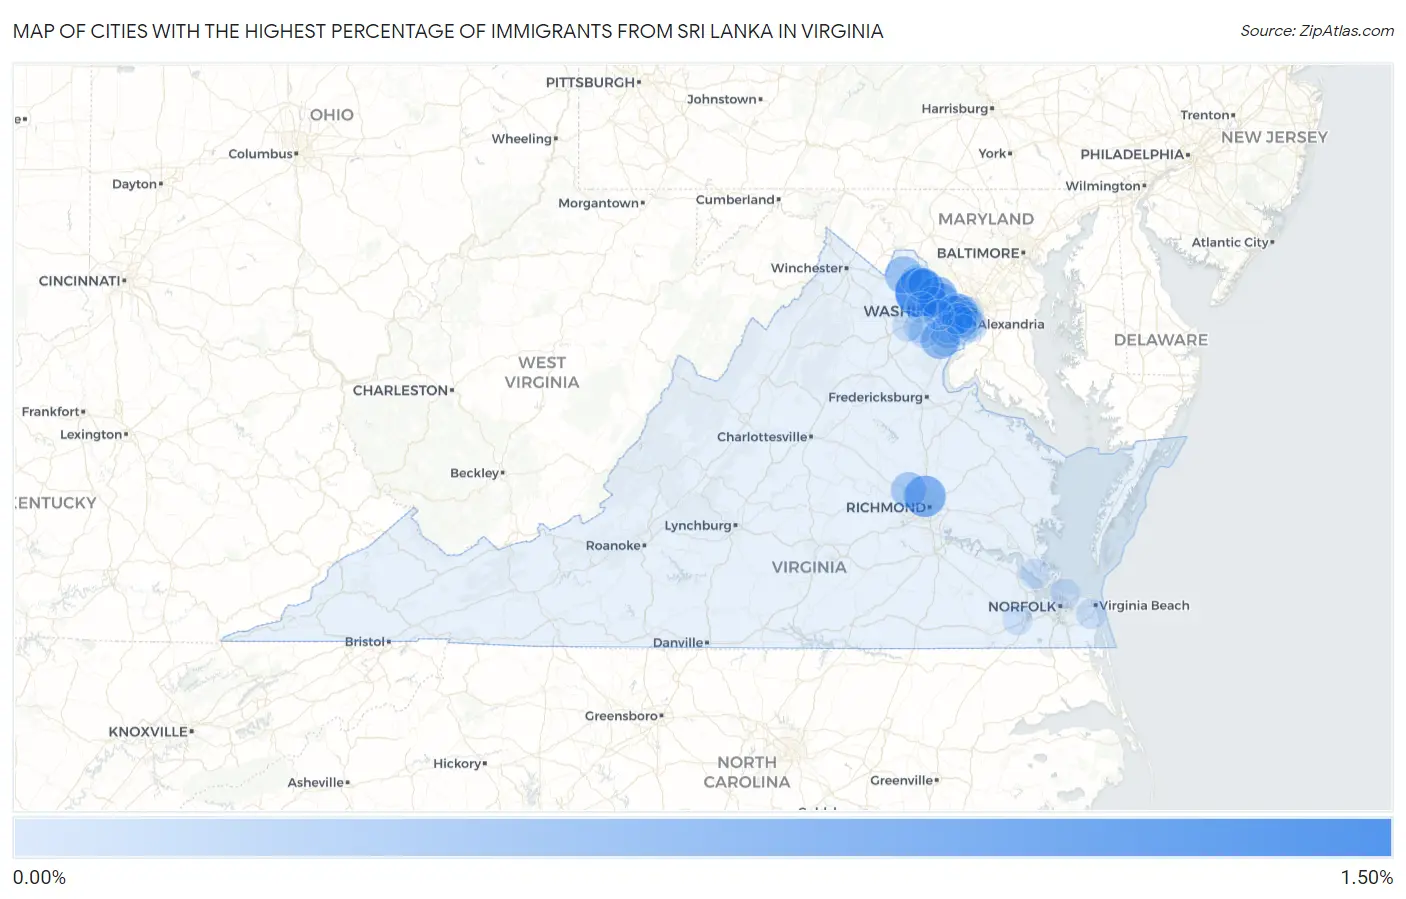
Map of Cities with the Highest Percentage of Immigrants from Sri Lanka in Virginia
0.00%
1.50%
Cities with the Highest Percentage of Immigrants from Sri Lanka in Virginia
| City | Sri Lanka | vs State | vs National | |
| 1. | Broadlands | 1.19% | 0.026%(+1.17)#26 | 0.017%(+1.18)#208 |
| 2. | Lakeside | 0.68% | 0.026%(+0.659)#27 | 0.017%(+0.667)#209 |
| 3. | Reston | 0.57% | 0.026%(+0.548)#28 | 0.017%(+0.557)#215 |
| 4. | Dranesville | 0.56% | 0.026%(+0.534)#107 | 0.017%(+0.542)#1,288 |
| 5. | County Center | 0.50% | 0.026%(+0.471)#108 | 0.017%(+0.480)#1,289 |
| 6. | West Falls Church | 0.49% | 0.026%(+0.466)#135 | 0.017%(+0.475)#2,238 |
| 7. | Hamilton | 0.45% | 0.026%(+0.419)#136 | 0.017%(+0.428)#2,239 |
| 8. | Falls Church | 0.38% | 0.026%(+0.351)#137 | 0.017%(+0.360)#2,240 |
| 9. | Idylwood | 0.35% | 0.026%(+0.323)#138 | 0.017%(+0.331)#2,241 |
| 10. | Braddock | 0.35% | 0.026%(+0.320)#139 | 0.017%(+0.329)#2,242 |
| 11. | Short Pump | 0.33% | 0.026%(+0.309)#140 | 0.017%(+0.317)#2,243 |
| 12. | Hutchison | 0.33% | 0.026%(+0.305)#141 | 0.017%(+0.314)#2,244 |
| 13. | South Run | 0.29% | 0.026%(+0.262)#142 | 0.017%(+0.271)#2,245 |
| 14. | Belmont | 0.22% | 0.026%(+0.197)#143 | 0.017%(+0.205)#2,246 |
| 15. | Bailey S Crossroads | 0.15% | 0.026%(+0.119)#144 | 0.017%(+0.128)#2,247 |
| 16. | Alexandria | 0.10% | 0.026%(+0.079)#145 | 0.017%(+0.088)#2,248 |
| 17. | Dunn Loring | 0.10% | 0.026%(+0.077)#146 | 0.017%(+0.086)#2,249 |
| 18. | Burke | 0.10% | 0.026%(+0.076)#147 | 0.017%(+0.085)#2,250 |
| 19. | Huntington | 0.10% | 0.026%(+0.075)#148 | 0.017%(+0.084)#2,251 |
| 20. | Lincolnia | 0.086% | 0.026%(+0.060)#149 | 0.017%(+0.069)#2,252 |
| 21. | Bull Run | 0.084% | 0.026%(+0.058)#150 | 0.017%(+0.067)#2,253 |
| 22. | Arlington | 0.082% | 0.026%(+0.056)#151 | 0.017%(+0.065)#2,254 |
| 23. | Mcnair | 0.081% | 0.026%(+0.055)#152 | 0.017%(+0.064)#2,255 |
| 24. | Leesburg | 0.078% | 0.026%(+0.053)#153 | 0.017%(+0.061)#2,256 |
| 25. | Kingstowne | 0.071% | 0.026%(+0.045)#154 | 0.017%(+0.054)#2,257 |
| 26. | Lansdowne | 0.070% | 0.026%(+0.044)#155 | 0.017%(+0.053)#2,258 |
| 27. | South Riding | 0.069% | 0.026%(+0.043)#156 | 0.017%(+0.052)#2,259 |
| 28. | Annandale | 0.069% | 0.026%(+0.043)#157 | 0.017%(+0.051)#2,260 |
| 29. | Rose Hill Cdp Fairfax County | 0.066% | 0.026%(+0.040)#158 | 0.017%(+0.049)#2,261 |
| 30. | Manassas | 0.052% | 0.026%(+0.026)#159 | 0.017%(+0.035)#2,262 |
| 31. | Gainesville | 0.047% | 0.026%(+0.021)#160 | 0.017%(+0.030)#2,263 |
| 32. | Lake Ridge | 0.036% | 0.026%(+0.010)#161 | 0.017%(+0.019)#2,264 |
| 33. | Fair Oaks | 0.026% | 0.026%(-0.000)#162 | 0.017%(+0.009)#2,265 |
| 34. | Virginia Beach | 0.017% | 0.026%(-0.008)#163 | 0.017%(+0.000)#2,266 |
| 35. | Newport News | 0.014% | 0.026%(-0.012)#164 | 0.017%(-0.003)#2,370 |
| 36. | Norfolk | 0.011% | 0.026%(-0.015)#165 | 0.017%(-0.006)#2,371 |
| 37. | Suffolk | 0.0084% | 0.026%(-0.017)#166 | 0.017%(-0.009)#2,372 |
Common Questions
What are the Top 10 Cities with the Highest Percentage of Immigrants from Sri Lanka in Virginia?
Top 10 Cities with the Highest Percentage of Immigrants from Sri Lanka in Virginia are:
#1
1.19%
#2
0.68%
#3
0.57%
#4
0.56%
#5
0.50%
#6
0.49%
#7
0.45%
#8
0.38%
#9
0.35%
#10
0.33%
What city has the Highest Percentage of Immigrants from Sri Lanka in Virginia?
Broadlands has the Highest Percentage of Immigrants from Sri Lanka in Virginia with 1.19%.
What is the Percentage of Immigrants from Sri Lanka in the State of Virginia?
Percentage of Immigrants from Sri Lanka in Virginia is 0.026%.
What is the Percentage of Immigrants from Sri Lanka in the United States?
Percentage of Immigrants from Sri Lanka in the United States is 0.017%.