Cities with the Highest Percentage of Population Employed in Farming, Fishing & Forestry in Indiana
RELATED REPORTS & OPTIONS
Farming, Fishing & Forestry
Indiana
Compare Cities
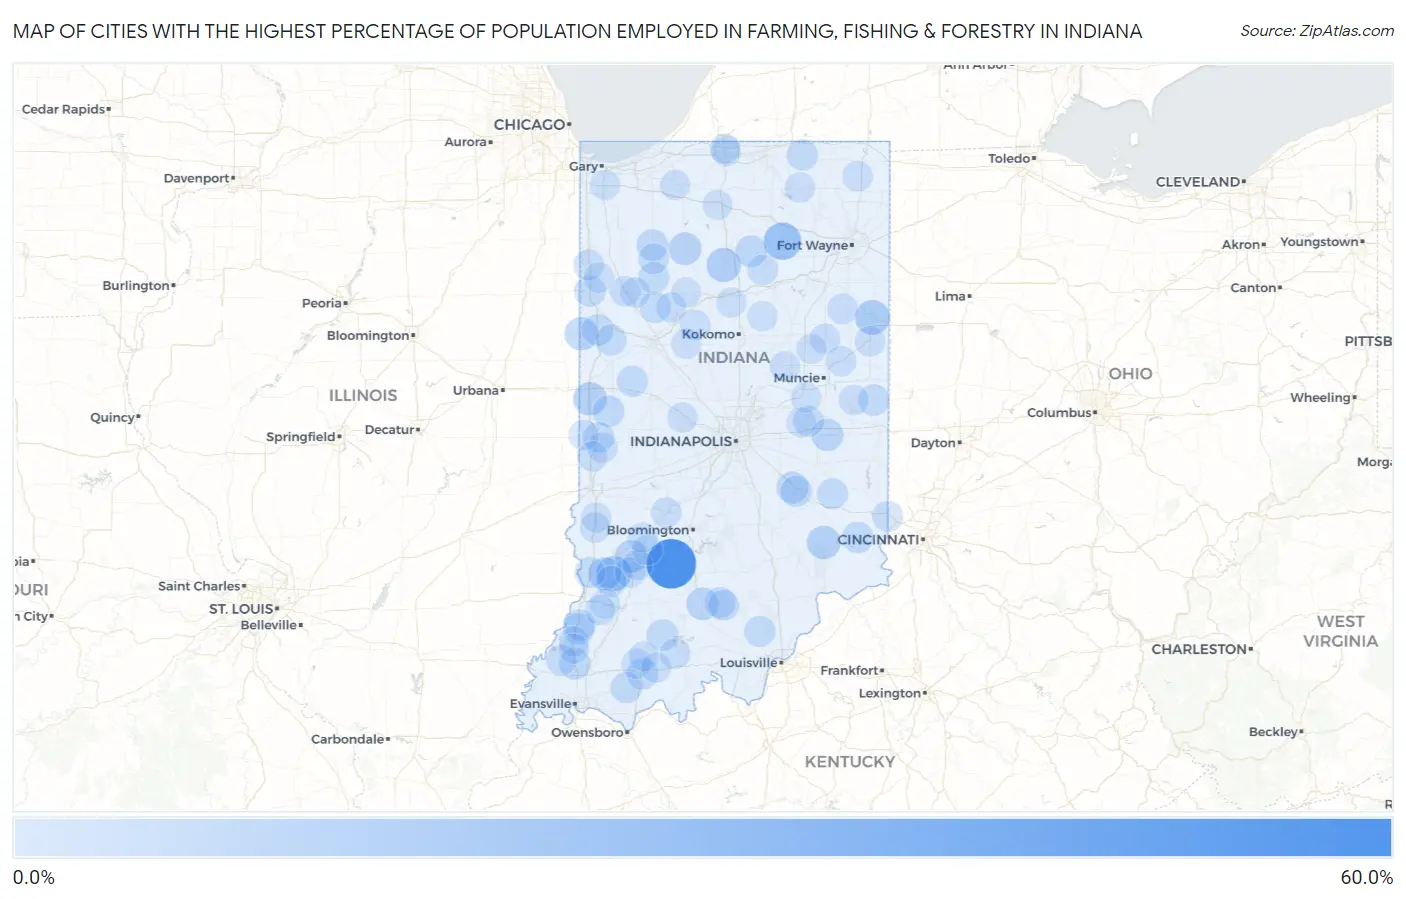
Map of Cities with the Highest Percentage of Population Employed in Farming, Fishing & Forestry in Indiana
0.0%
60.0%
Cities with the Highest Percentage of Population Employed in Farming, Fishing & Forestry in Indiana
| City | % Employed | vs State | vs National | |
| 1. | Hashtown | 55.0% | 0.39%(+54.6)#1 | 0.61%(+54.4)#63 |
| 2. | Owensburg | 54.8% | 0.39%(+54.4)#2 | 0.61%(+54.2)#65 |
| 3. | Fair Oaks | 38.0% | 0.39%(+37.6)#3 | 0.61%(+37.4)#139 |
| 4. | Brownsville | 31.5% | 0.39%(+31.1)#4 | 0.61%(+30.9)#197 |
| 5. | Marshfield | 22.9% | 0.39%(+22.5)#5 | 0.61%(+22.3)#366 |
| 6. | Sidney | 20.5% | 0.39%(+20.1)#6 | 0.61%(+19.9)#425 |
| 7. | Poland | 18.2% | 0.39%(+17.8)#7 | 0.61%(+17.6)#503 |
| 8. | Prospect | 14.9% | 0.39%(+14.5)#8 | 0.61%(+14.3)#651 |
| 9. | Westphalia | 14.3% | 0.39%(+13.9)#9 | 0.61%(+13.7)#693 |
| 10. | Geneva | 13.5% | 0.39%(+13.1)#10 | 0.61%(+12.9)#744 |
| 11. | Young America | 13.0% | 0.39%(+12.7)#11 | 0.61%(+12.4)#780 |
| 12. | Fulton | 11.9% | 0.39%(+11.5)#12 | 0.61%(+11.3)#877 |
| 13. | Perrysville | 10.2% | 0.39%(+9.85)#13 | 0.61%(+9.63)#1,045 |
| 14. | Holton | 10.0% | 0.39%(+9.65)#14 | 0.61%(+9.43)#1,063 |
| 15. | Pittsburg | 9.9% | 0.39%(+9.47)#15 | 0.61%(+9.25)#1,098 |
| 16. | Ambia | 9.6% | 0.39%(+9.25)#16 | 0.61%(+9.03)#1,124 |
| 17. | Freelandville | 8.7% | 0.39%(+8.29)#17 | 0.61%(+8.07)#1,286 |
| 18. | Winamac | 8.3% | 0.39%(+7.93)#18 | 0.61%(+7.71)#1,368 |
| 19. | Lyons | 8.1% | 0.39%(+7.74)#19 | 0.61%(+7.52)#1,398 |
| 20. | Orleans | 7.3% | 0.39%(+6.96)#20 | 0.61%(+6.74)#1,584 |
| 21. | Lewisville | 6.6% | 0.39%(+6.24)#21 | 0.61%(+6.02)#1,755 |
| 22. | Waldron | 5.8% | 0.39%(+5.40)#22 | 0.61%(+5.18)#1,991 |
| 23. | Akron | 5.6% | 0.39%(+5.23)#23 | 0.61%(+5.01)#2,051 |
| 24. | Fort Branch | 5.5% | 0.39%(+5.09)#24 | 0.61%(+4.87)#2,110 |
| 25. | Medaryville | 5.3% | 0.39%(+4.88)#25 | 0.61%(+4.66)#2,198 |
| 26. | Kingman | 5.0% | 0.39%(+4.66)#26 | 0.61%(+4.44)#2,283 |
| 27. | Haysville | 5.0% | 0.39%(+4.57)#27 | 0.61%(+4.34)#2,323 |
| 28. | Boswell | 4.8% | 0.39%(+4.43)#28 | 0.61%(+4.21)#2,389 |
| 29. | Dale | 4.6% | 0.39%(+4.24)#29 | 0.61%(+4.02)#2,477 |
| 30. | Dubois | 4.6% | 0.39%(+4.18)#30 | 0.61%(+3.96)#2,504 |
| 31. | Hazleton | 4.5% | 0.39%(+4.16)#31 | 0.61%(+3.94)#2,511 |
| 32. | Tennyson | 4.5% | 0.39%(+4.09)#32 | 0.61%(+3.87)#2,555 |
| 33. | St Paul | 4.5% | 0.39%(+4.08)#33 | 0.61%(+3.86)#2,561 |
| 34. | Moores Hill | 4.4% | 0.39%(+4.01)#34 | 0.61%(+3.79)#2,590 |
| 35. | Shipshewana | 4.3% | 0.39%(+3.96)#35 | 0.61%(+3.74)#2,618 |
| 36. | Kentland | 4.3% | 0.39%(+3.91)#36 | 0.61%(+3.69)#2,651 |
| 37. | Wingate | 4.2% | 0.39%(+3.81)#37 | 0.61%(+3.59)#2,706 |
| 38. | Pine Village | 4.1% | 0.39%(+3.71)#38 | 0.61%(+3.49)#2,764 |
| 39. | Lynn | 4.1% | 0.39%(+3.70)#39 | 0.61%(+3.48)#2,769 |
| 40. | Monon | 4.1% | 0.39%(+3.68)#40 | 0.61%(+3.46)#2,786 |
| 41. | Decker | 4.0% | 0.39%(+3.66)#41 | 0.61%(+3.43)#2,798 |
| 42. | Borden | 4.0% | 0.39%(+3.59)#42 | 0.61%(+3.37)#2,838 |
| 43. | Saltillo | 4.0% | 0.39%(+3.58)#43 | 0.61%(+3.35)#2,852 |
| 44. | Lake Santee | 3.8% | 0.39%(+3.45)#44 | 0.61%(+3.23)#2,945 |
| 45. | Chalmers | 3.7% | 0.39%(+3.30)#45 | 0.61%(+3.08)#3,050 |
| 46. | Montezuma | 3.6% | 0.39%(+3.20)#46 | 0.61%(+2.98)#3,138 |
| 47. | West Harrison | 3.4% | 0.39%(+3.02)#47 | 0.61%(+2.80)#3,289 |
| 48. | Oaktown | 3.4% | 0.39%(+2.98)#48 | 0.61%(+2.76)#3,316 |
| 49. | Campbellsburg | 3.2% | 0.39%(+2.80)#49 | 0.61%(+2.58)#3,467 |
| 50. | Edwardsport | 3.1% | 0.39%(+2.76)#50 | 0.61%(+2.54)#3,507 |
| 51. | Francesville | 2.8% | 0.39%(+2.44)#51 | 0.61%(+2.21)#3,832 |
| 52. | Owensville | 2.6% | 0.39%(+2.24)#52 | 0.61%(+2.02)#4,051 |
| 53. | Kennard | 2.6% | 0.39%(+2.22)#53 | 0.61%(+2.00)#4,070 |
| 54. | Morocco | 2.5% | 0.39%(+2.10)#54 | 0.61%(+1.88)#4,228 |
| 55. | Hudson | 2.4% | 0.39%(+2.04)#55 | 0.61%(+1.82)#4,288 |
| 56. | Elnora | 2.4% | 0.39%(+2.04)#56 | 0.61%(+1.82)#4,289 |
| 57. | Flora | 2.4% | 0.39%(+2.03)#57 | 0.61%(+1.81)#4,297 |
| 58. | Remington | 2.4% | 0.39%(+1.97)#58 | 0.61%(+1.75)#4,385 |
| 59. | Poneto | 2.3% | 0.39%(+1.94)#59 | 0.61%(+1.72)#4,425 |
| 60. | Portland | 2.3% | 0.39%(+1.89)#60 | 0.61%(+1.67)#4,465 |
| 61. | Hartford City | 2.2% | 0.39%(+1.79)#61 | 0.61%(+1.57)#4,597 |
| 62. | Birdseye | 2.2% | 0.39%(+1.78)#62 | 0.61%(+1.56)#4,628 |
| 63. | Ligonier | 2.1% | 0.39%(+1.74)#63 | 0.61%(+1.52)#4,669 |
| 64. | Newberry | 2.1% | 0.39%(+1.74)#64 | 0.61%(+1.52)#4,680 |
| 65. | Wolcott | 2.1% | 0.39%(+1.73)#65 | 0.61%(+1.51)#4,701 |
| 66. | Albany | 2.1% | 0.39%(+1.72)#66 | 0.61%(+1.50)#4,710 |
| 67. | Mecca | 2.1% | 0.39%(+1.72)#67 | 0.61%(+1.50)#4,711 |
| 68. | Modoc | 2.1% | 0.39%(+1.70)#68 | 0.61%(+1.48)#4,734 |
| 69. | Roann | 2.0% | 0.39%(+1.66)#69 | 0.61%(+1.44)#4,808 |
| 70. | Bloomfield | 2.0% | 0.39%(+1.58)#70 | 0.61%(+1.36)#4,925 |
| 71. | Dana | 1.9% | 0.39%(+1.56)#71 | 0.61%(+1.34)#4,958 |
| 72. | Spencer | 1.9% | 0.39%(+1.53)#72 | 0.61%(+1.31)#5,007 |
| 73. | Orestes | 1.9% | 0.39%(+1.50)#73 | 0.61%(+1.28)#5,053 |
| 74. | Jamestown | 1.9% | 0.39%(+1.49)#74 | 0.61%(+1.27)#5,080 |
| 75. | Yeoman | 1.8% | 0.39%(+1.40)#75 | 0.61%(+1.18)#5,214 |
| 76. | Shelburn | 1.7% | 0.39%(+1.32)#76 | 0.61%(+1.10)#5,350 |
| 77. | Kingsford Heights | 1.7% | 0.39%(+1.32)#77 | 0.61%(+1.10)#5,355 |
| 78. | Clinton | 1.6% | 0.39%(+1.23)#78 | 0.61%(+1.01)#5,517 |
| 79. | Enchanted Hills | 1.5% | 0.39%(+1.16)#79 | 0.61%(+0.938)#5,671 |
| 80. | Farmersburg | 1.5% | 0.39%(+1.14)#80 | 0.61%(+0.918)#5,712 |
| 81. | Brook | 1.5% | 0.39%(+1.11)#81 | 0.61%(+0.887)#5,771 |
| 82. | Matthews | 1.5% | 0.39%(+1.07)#82 | 0.61%(+0.851)#5,858 |
| 83. | Holland | 1.5% | 0.39%(+1.07)#83 | 0.61%(+0.848)#5,864 |
| 84. | Wheatland | 1.4% | 0.39%(+1.03)#84 | 0.61%(+0.810)#5,946 |
| 85. | Ferdinand | 1.4% | 0.39%(+1.02)#85 | 0.61%(+0.800)#5,963 |
| 86. | Onward | 1.4% | 0.39%(+0.985)#86 | 0.61%(+0.764)#6,035 |
| 87. | Patoka | 1.4% | 0.39%(+0.975)#87 | 0.61%(+0.755)#6,059 |
| 88. | Princeton | 1.3% | 0.39%(+0.955)#88 | 0.61%(+0.735)#6,110 |
| 89. | Shirley | 1.3% | 0.39%(+0.954)#89 | 0.61%(+0.734)#6,113 |
| 90. | Worthington | 1.3% | 0.39%(+0.950)#90 | 0.61%(+0.730)#6,121 |
| 91. | Burnettsville | 1.3% | 0.39%(+0.922)#91 | 0.61%(+0.702)#6,193 |
| 92. | Merrillville | 1.3% | 0.39%(+0.900)#92 | 0.61%(+0.680)#6,247 |
| 93. | Notre Dame | 1.3% | 0.39%(+0.898)#93 | 0.61%(+0.678)#6,253 |
| 94. | Monroe City | 1.3% | 0.39%(+0.893)#94 | 0.61%(+0.673)#6,264 |
| 95. | Roseland | 1.3% | 0.39%(+0.883)#95 | 0.61%(+0.663)#6,288 |
| 96. | Middletown | 1.3% | 0.39%(+0.869)#96 | 0.61%(+0.648)#6,336 |
| 97. | Amboy | 1.2% | 0.39%(+0.857)#97 | 0.61%(+0.637)#6,369 |
| 98. | Huntingburg | 1.2% | 0.39%(+0.848)#98 | 0.61%(+0.628)#6,391 |
| 99. | Plymouth | 1.2% | 0.39%(+0.842)#99 | 0.61%(+0.622)#6,403 |
| 100. | Rossville | 1.2% | 0.39%(+0.825)#100 | 0.61%(+0.605)#6,442 |
Common Questions
What are the Top 10 Cities with the Highest Percentage of Population Employed in Farming, Fishing & Forestry in Indiana?
Top 10 Cities with the Highest Percentage of Population Employed in Farming, Fishing & Forestry in Indiana are:
#1
54.8%
#2
20.5%
#3
14.3%
#4
13.5%
#5
11.9%
#6
10.2%
#7
10.0%
#8
9.6%
#9
8.7%
#10
8.3%
What city has the Highest Percentage of Population Employed in Farming, Fishing & Forestry in Indiana?
Owensburg has the Highest Percentage of Population Employed in Farming, Fishing & Forestry in Indiana with 54.8%.
What is the Percentage of Population Employed in Farming, Fishing & Forestry in the State of Indiana?
Percentage of Population Employed in Farming, Fishing & Forestry in Indiana is 0.39%.
What is the Percentage of Population Employed in Farming, Fishing & Forestry in the United States?
Percentage of Population Employed in Farming, Fishing & Forestry in the United States is 0.61%.