Cities with the Highest Percentage of Population Employed in Farming, Fishing & Forestry in Maryland
RELATED REPORTS & OPTIONS
Farming, Fishing & Forestry
Maryland
Compare Cities
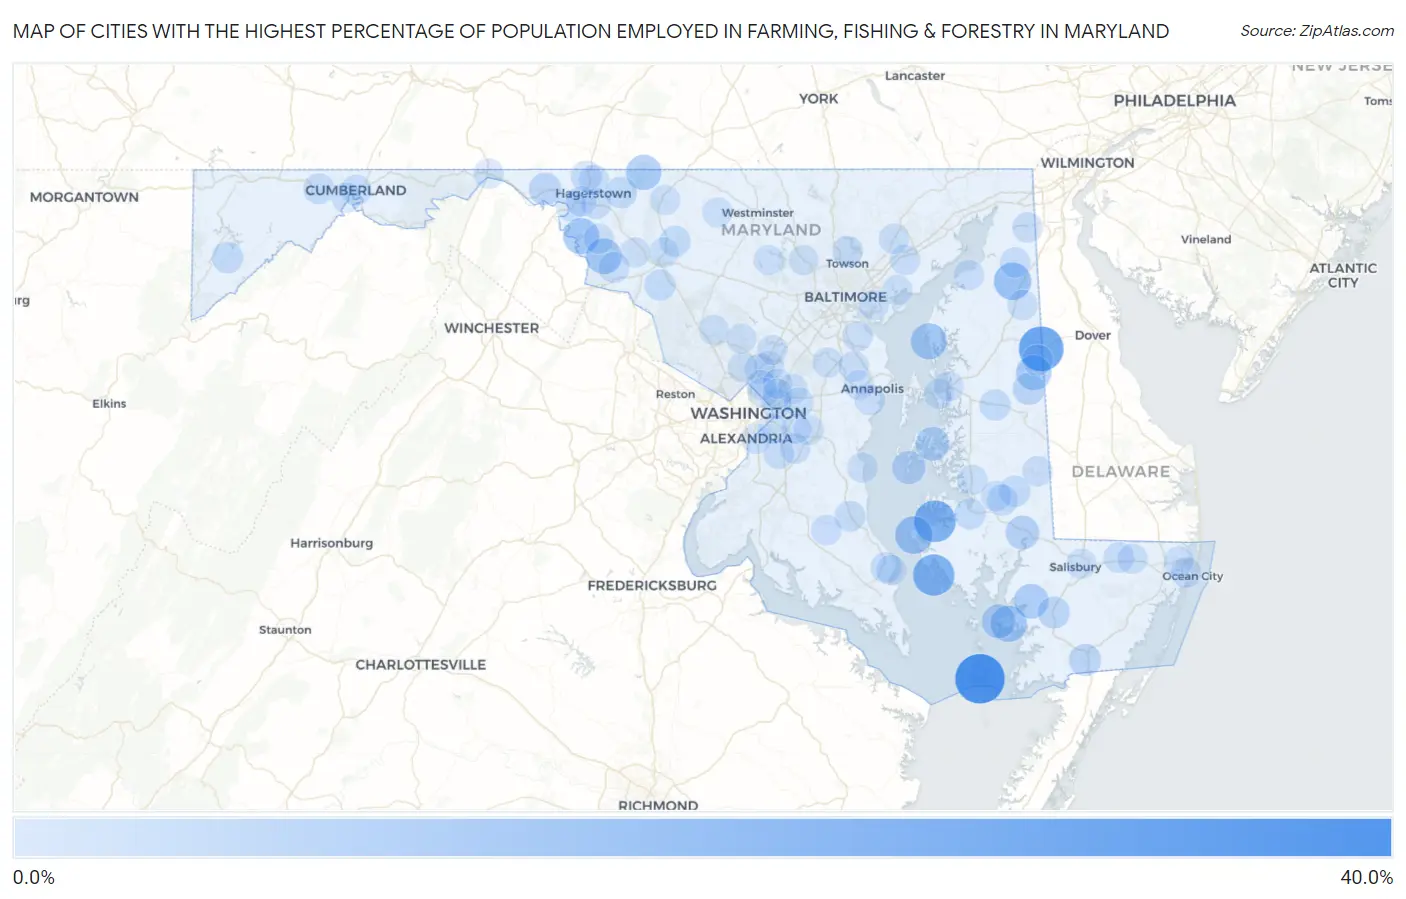
Map of Cities with the Highest Percentage of Population Employed in Farming, Fishing & Forestry in Maryland
0.0%
40.0%
Cities with the Highest Percentage of Population Employed in Farming, Fishing & Forestry in Maryland
| City | % Employed | vs State | vs National | |
| 1. | Smith Island | 33.5% | 0.21%(+33.3)#1 | 0.61%(+32.9)#174 |
| 2. | Marydel | 25.0% | 0.21%(+24.8)#2 | 0.61%(+24.4)#323 |
| 3. | Chesapeake Landing | 20.5% | 0.21%(+20.3)#3 | 0.61%(+19.9)#424 |
| 4. | Madison | 19.7% | 0.21%(+19.5)#4 | 0.61%(+19.1)#453 |
| 5. | Fishing Creek | 19.1% | 0.21%(+18.9)#5 | 0.61%(+18.5)#469 |
| 6. | Taylors Island | 12.5% | 0.21%(+12.3)#6 | 0.61%(+11.9)#825 |
| 7. | Galena | 12.2% | 0.21%(+12.0)#7 | 0.61%(+11.6)#851 |
| 8. | Dames Quarter | 10.5% | 0.21%(+10.2)#8 | 0.61%(+9.85)#1,017 |
| 9. | Mercersville | 10.0% | 0.21%(+9.79)#9 | 0.61%(+9.39)#1,068 |
| 10. | Rock Hall | 9.9% | 0.21%(+9.72)#10 | 0.61%(+9.33)#1,082 |
| 11. | Trego Rohrersville Station | 9.5% | 0.21%(+9.25)#11 | 0.61%(+8.86)#1,156 |
| 12. | Highfield Cascade | 8.6% | 0.21%(+8.42)#12 | 0.61%(+8.03)#1,292 |
| 13. | Goldsboro | 8.5% | 0.21%(+8.32)#13 | 0.61%(+7.93)#1,316 |
| 14. | Mount Vernon | 7.6% | 0.21%(+7.43)#14 | 0.61%(+7.04)#1,514 |
| 15. | Chance | 6.6% | 0.21%(+6.40)#15 | 0.61%(+6.01)#1,757 |
| 16. | St Michaels | 6.2% | 0.21%(+5.95)#16 | 0.61%(+5.56)#1,871 |
| 17. | Vienna | 5.9% | 0.21%(+5.70)#17 | 0.61%(+5.31)#1,953 |
| 18. | Tilghman Island | 5.2% | 0.21%(+5.04)#18 | 0.61%(+4.64)#2,208 |
| 19. | Greensboro | 3.7% | 0.21%(+3.51)#19 | 0.61%(+3.12)#3,016 |
| 20. | Clear Spring | 3.6% | 0.21%(+3.41)#20 | 0.61%(+3.01)#3,109 |
| 21. | Pocomoke City | 3.3% | 0.21%(+3.12)#21 | 0.61%(+2.73)#3,346 |
| 22. | Princess Anne | 3.2% | 0.21%(+3.03)#22 | 0.61%(+2.64)#3,416 |
| 23. | Deer Park | 2.7% | 0.21%(+2.45)#23 | 0.61%(+2.06)#4,000 |
| 24. | Cavetown | 2.7% | 0.21%(+2.45)#24 | 0.61%(+2.06)#4,004 |
| 25. | Buckeystown | 2.0% | 0.21%(+1.76)#25 | 0.61%(+1.37)#4,911 |
| 26. | Cambridge | 2.0% | 0.21%(+1.75)#26 | 0.61%(+1.36)#4,922 |
| 27. | Queen Anne | 2.0% | 0.21%(+1.75)#27 | 0.61%(+1.36)#4,936 |
| 28. | Hurlock | 1.9% | 0.21%(+1.67)#28 | 0.61%(+1.28)#5,063 |
| 29. | East New Market | 1.6% | 0.21%(+1.44)#29 | 0.61%(+1.04)#5,464 |
| 30. | Walkersville | 1.6% | 0.21%(+1.40)#30 | 0.61%(+1.01)#5,542 |
| 31. | Lusby | 1.6% | 0.21%(+1.39)#31 | 0.61%(+0.996)#5,564 |
| 32. | Ten Mile Creek | 1.6% | 0.21%(+1.35)#32 | 0.61%(+0.957)#5,639 |
| 33. | Frostburg | 1.5% | 0.21%(+1.32)#33 | 0.61%(+0.925)#5,700 |
| 34. | Timonium | 1.5% | 0.21%(+1.24)#34 | 0.61%(+0.845)#5,869 |
| 35. | Henderson | 1.4% | 0.21%(+1.22)#35 | 0.61%(+0.823)#5,925 |
| 36. | Burkittsville | 1.4% | 0.21%(+1.20)#36 | 0.61%(+0.803)#5,958 |
| 37. | Romancoke | 1.4% | 0.21%(+1.14)#37 | 0.61%(+0.749)#6,075 |
| 38. | Maugansville | 1.3% | 0.21%(+1.05)#38 | 0.61%(+0.656)#6,316 |
| 39. | Prince Frederick | 1.2% | 0.21%(+0.958)#39 | 0.61%(+0.565)#6,547 |
| 40. | Pittsville | 1.0% | 0.21%(+0.815)#40 | 0.61%(+0.422)#6,956 |
| 41. | Secretary | 0.98% | 0.21%(+0.767)#41 | 0.61%(+0.375)#7,098 |
| 42. | Cumberland | 0.96% | 0.21%(+0.742)#42 | 0.61%(+0.350)#7,161 |
| 43. | Funkstown | 0.93% | 0.21%(+0.717)#43 | 0.61%(+0.325)#7,248 |
| 44. | Betterton | 0.83% | 0.21%(+0.620)#44 | 0.61%(+0.228)#7,583 |
| 45. | White Oak | 0.81% | 0.21%(+0.596)#45 | 0.61%(+0.204)#7,678 |
| 46. | Williamsport | 0.79% | 0.21%(+0.578)#46 | 0.61%(+0.185)#7,744 |
| 47. | Federalsburg | 0.76% | 0.21%(+0.548)#47 | 0.61%(+0.156)#7,859 |
| 48. | Golden Beach | 0.72% | 0.21%(+0.507)#48 | 0.61%(+0.115)#8,013 |
| 49. | Herald Harbor | 0.72% | 0.21%(+0.505)#49 | 0.61%(+0.112)#8,026 |
| 50. | Joppatowne | 0.70% | 0.21%(+0.484)#50 | 0.61%(+0.092)#8,102 |
| 51. | Halfway | 0.70% | 0.21%(+0.483)#51 | 0.61%(+0.091)#8,109 |
| 52. | Cecilton | 0.67% | 0.21%(+0.455)#52 | 0.61%(+0.063)#8,217 |
| 53. | Annapolis Neck | 0.66% | 0.21%(+0.442)#53 | 0.61%(+0.049)#8,270 |
| 54. | Clinton | 0.65% | 0.21%(+0.435)#54 | 0.61%(+0.043)#8,302 |
| 55. | Millington | 0.63% | 0.21%(+0.414)#55 | 0.61%(+0.021)#8,383 |
| 56. | Woodlawn Cdp Prince George S County | 0.57% | 0.21%(+0.357)#56 | 0.61%(-0.035)#8,631 |
| 57. | Trappe | 0.55% | 0.21%(+0.335)#57 | 0.61%(-0.057)#8,740 |
| 58. | Fountainhead Orchard Hills | 0.54% | 0.21%(+0.327)#58 | 0.61%(-0.066)#8,788 |
| 59. | West Ocean City | 0.52% | 0.21%(+0.308)#59 | 0.61%(-0.085)#8,875 |
| 60. | Willards | 0.52% | 0.21%(+0.308)#60 | 0.61%(-0.085)#8,877 |
| 61. | Chesapeake City | 0.52% | 0.21%(+0.302)#61 | 0.61%(-0.090)#8,902 |
| 62. | Woodlawn Cdp Baltimore County | 0.50% | 0.21%(+0.285)#62 | 0.61%(-0.108)#8,989 |
| 63. | Cheverly | 0.48% | 0.21%(+0.265)#63 | 0.61%(-0.127)#9,093 |
| 64. | Silver Hill | 0.48% | 0.21%(+0.265)#64 | 0.61%(-0.128)#9,097 |
| 65. | Pleasant Hills | 0.46% | 0.21%(+0.251)#65 | 0.61%(-0.142)#9,184 |
| 66. | Grasonville | 0.46% | 0.21%(+0.242)#66 | 0.61%(-0.150)#9,228 |
| 67. | Calverton | 0.44% | 0.21%(+0.226)#67 | 0.61%(-0.167)#9,341 |
| 68. | Chesapeake Ranch Estates | 0.43% | 0.21%(+0.220)#68 | 0.61%(-0.173)#9,378 |
| 69. | Frederick | 0.40% | 0.21%(+0.184)#69 | 0.61%(-0.209)#9,566 |
| 70. | Union Bridge | 0.38% | 0.21%(+0.167)#70 | 0.61%(-0.225)#9,669 |
| 71. | Keedysville | 0.38% | 0.21%(+0.162)#71 | 0.61%(-0.230)#9,698 |
| 72. | Seabrook | 0.37% | 0.21%(+0.161)#72 | 0.61%(-0.231)#9,700 |
| 73. | Forest Heights | 0.36% | 0.21%(+0.146)#73 | 0.61%(-0.246)#9,793 |
| 74. | Wheaton | 0.35% | 0.21%(+0.138)#74 | 0.61%(-0.254)#9,842 |
| 75. | Bowling Green | 0.35% | 0.21%(+0.138)#75 | 0.61%(-0.255)#9,845 |
| 76. | Langley Park | 0.34% | 0.21%(+0.128)#76 | 0.61%(-0.264)#9,910 |
| 77. | Ocean Pines | 0.34% | 0.21%(+0.128)#77 | 0.61%(-0.265)#9,911 |
| 78. | Hancock | 0.31% | 0.21%(+0.095)#78 | 0.61%(-0.297)#10,101 |
| 79. | Middletown | 0.31% | 0.21%(+0.092)#79 | 0.61%(-0.300)#10,127 |
| 80. | Eldersburg | 0.30% | 0.21%(+0.092)#80 | 0.61%(-0.301)#10,131 |
| 81. | North Beach | 0.29% | 0.21%(+0.073)#81 | 0.61%(-0.320)#10,238 |
| 82. | Thurmont | 0.28% | 0.21%(+0.070)#82 | 0.61%(-0.322)#10,254 |
| 83. | Pasadena | 0.28% | 0.21%(+0.066)#83 | 0.61%(-0.327)#10,278 |
| 84. | Chillum | 0.26% | 0.21%(+0.048)#84 | 0.61%(-0.344)#10,385 |
| 85. | Queenstown | 0.26% | 0.21%(+0.045)#85 | 0.61%(-0.348)#10,405 |
| 86. | Marlboro Village | 0.26% | 0.21%(+0.043)#86 | 0.61%(-0.350)#10,419 |
| 87. | Rosaryville | 0.25% | 0.21%(+0.034)#87 | 0.61%(-0.359)#10,476 |
| 88. | Bowleys Quarters | 0.24% | 0.21%(+0.028)#88 | 0.61%(-0.365)#10,513 |
| 89. | Salisbury | 0.24% | 0.21%(+0.027)#89 | 0.61%(-0.366)#10,524 |
| 90. | Berwyn Heights | 0.24% | 0.21%(+0.026)#90 | 0.61%(-0.366)#10,526 |
| 91. | Burtonsville | 0.23% | 0.21%(+0.021)#91 | 0.61%(-0.371)#10,560 |
| 92. | Dundalk | 0.23% | 0.21%(+0.021)#92 | 0.61%(-0.371)#10,561 |
| 93. | East Riverdale | 0.23% | 0.21%(+0.021)#93 | 0.61%(-0.372)#10,563 |
| 94. | Olney | 0.23% | 0.21%(+0.017)#94 | 0.61%(-0.375)#10,594 |
| 95. | Owings Mills | 0.22% | 0.21%(+0.005)#95 | 0.61%(-0.387)#10,677 |
| 96. | Westphalia | 0.21% | 0.21%(-0.001)#96 | 0.61%(-0.393)#10,710 |
| 97. | Montgomery Village | 0.19% | 0.21%(-0.026)#97 | 0.61%(-0.418)#10,862 |
| 98. | Mitchellville | 0.18% | 0.21%(-0.029)#98 | 0.61%(-0.421)#10,885 |
| 99. | Odenton | 0.18% | 0.21%(-0.033)#99 | 0.61%(-0.425)#10,906 |
| 100. | Parole | 0.18% | 0.21%(-0.035)#100 | 0.61%(-0.428)#10,925 |
Common Questions
What are the Top 10 Cities with the Highest Percentage of Population Employed in Farming, Fishing & Forestry in Maryland?
Top 10 Cities with the Highest Percentage of Population Employed in Farming, Fishing & Forestry in Maryland are:
#1
33.5%
#2
25.0%
#3
19.7%
#4
19.1%
#5
12.5%
#6
12.2%
#7
10.5%
#8
10.0%
#9
9.9%
#10
9.5%
What city has the Highest Percentage of Population Employed in Farming, Fishing & Forestry in Maryland?
Smith Island has the Highest Percentage of Population Employed in Farming, Fishing & Forestry in Maryland with 33.5%.
What is the Percentage of Population Employed in Farming, Fishing & Forestry in the State of Maryland?
Percentage of Population Employed in Farming, Fishing & Forestry in Maryland is 0.21%.
What is the Percentage of Population Employed in Farming, Fishing & Forestry in the United States?
Percentage of Population Employed in Farming, Fishing & Forestry in the United States is 0.61%.