Cities with the Highest Percentage of Population Employed in Farming, Fishing & Forestry in Texas
RELATED REPORTS & OPTIONS
Farming, Fishing & Forestry
Texas
Compare Cities
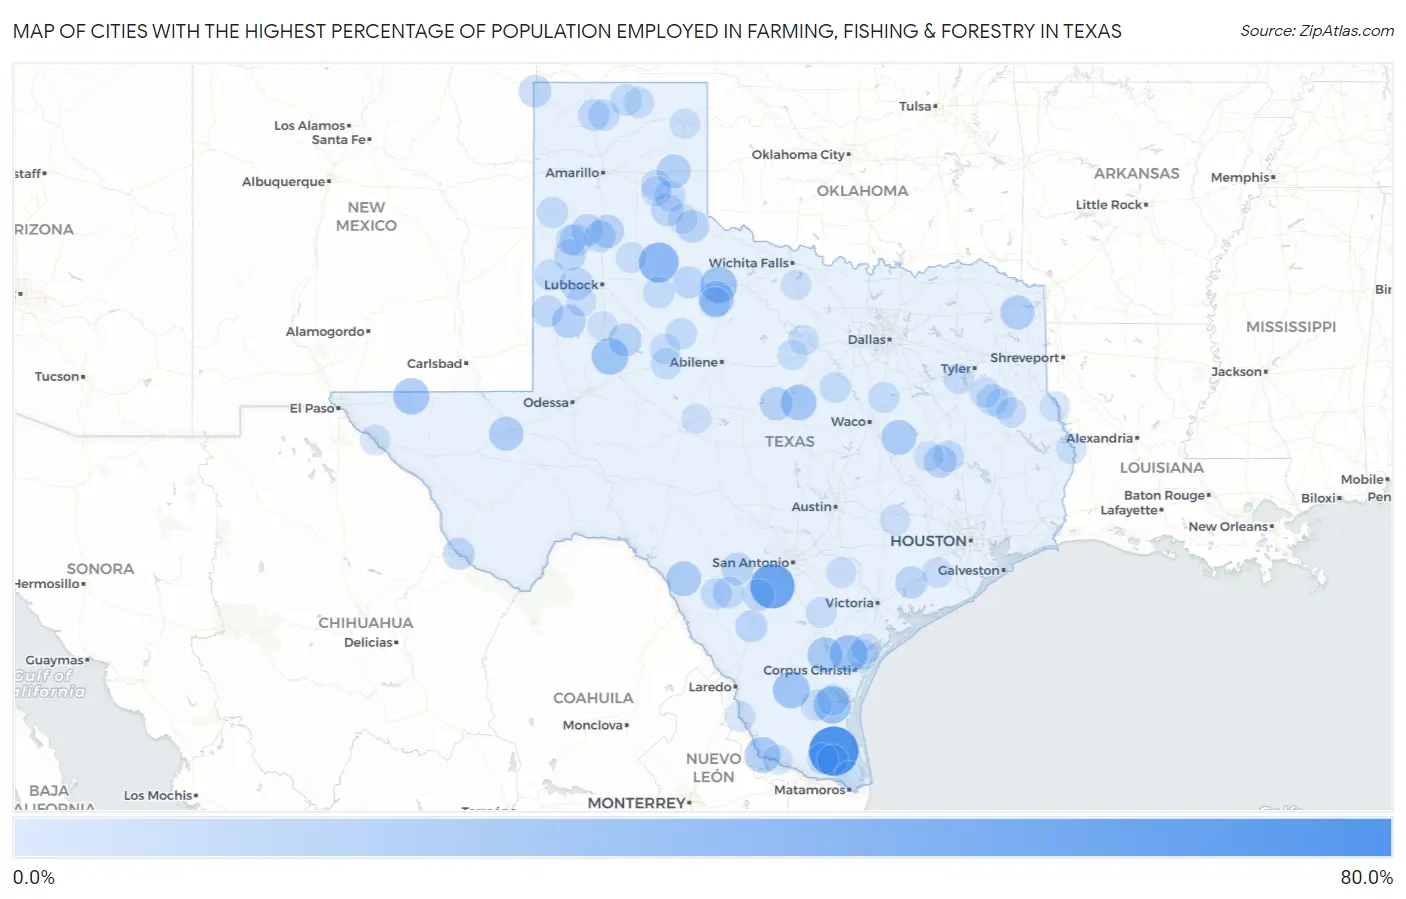
Map of Cities with the Highest Percentage of Population Employed in Farming, Fishing & Forestry in Texas
0.0%
80.0%
Cities with the Highest Percentage of Population Employed in Farming, Fishing & Forestry in Texas
| City | % Employed | vs State | vs National | |
| 1. | Los Angeles | 79.2% | 0.37%(+78.8)#1 | 0.61%(+78.6)#26 |
| 2. | Bigfoot | 59.6% | 0.37%(+59.2)#2 | 0.61%(+59.0)#48 |
| 3. | La Coma Heights | 46.2% | 0.37%(+45.8)#3 | 0.61%(+45.6)#89 |
| 4. | Fluvanna | 45.8% | 0.37%(+45.5)#4 | 0.61%(+45.2)#93 |
| 5. | Roaring Springs | 41.9% | 0.37%(+41.6)#5 | 0.61%(+41.3)#114 |
| 6. | Del Sol | 33.0% | 0.37%(+32.7)#6 | 0.61%(+32.4)#179 |
| 7. | Sarita | 32.6% | 0.37%(+32.2)#7 | 0.61%(+32.0)#188 |
| 8. | Petty | 30.8% | 0.37%(+30.4)#8 | 0.61%(+30.2)#207 |
| 9. | Realitos | 30.8% | 0.37%(+30.4)#9 | 0.61%(+30.2)#209 |
| 10. | Ackerly | 30.7% | 0.37%(+30.4)#10 | 0.61%(+30.1)#212 |
| 11. | Benjamin | 29.9% | 0.37%(+29.5)#11 | 0.61%(+29.3)#224 |
| 12. | Dell City | 28.6% | 0.37%(+28.2)#12 | 0.61%(+28.0)#245 |
| 13. | Gustine | 26.9% | 0.37%(+26.6)#13 | 0.61%(+26.3)#281 |
| 14. | Ramos | 26.7% | 0.37%(+26.3)#14 | 0.61%(+26.1)#290 |
| 15. | O Brien | 25.9% | 0.37%(+25.6)#15 | 0.61%(+25.3)#305 |
| 16. | Priddy | 25.9% | 0.37%(+25.5)#16 | 0.61%(+25.3)#306 |
| 17. | Lelia Lake | 25.8% | 0.37%(+25.4)#17 | 0.61%(+25.2)#308 |
| 18. | K Bar Ranch | 25.2% | 0.37%(+24.9)#18 | 0.61%(+24.6)#320 |
| 19. | Bluff Dale | 25.0% | 0.37%(+24.6)#19 | 0.61%(+24.4)#324 |
| 20. | Petronilla | 23.7% | 0.37%(+23.3)#20 | 0.61%(+23.1)#345 |
| 21. | Kosse | 23.7% | 0.37%(+23.3)#21 | 0.61%(+23.1)#346 |
| 22. | Spofford | 23.5% | 0.37%(+23.2)#22 | 0.61%(+22.9)#350 |
| 23. | Marietta | 21.4% | 0.37%(+21.1)#23 | 0.61%(+20.8)#395 |
| 24. | Lindsay | 21.2% | 0.37%(+20.9)#24 | 0.61%(+20.6)#404 |
| 25. | Mclean | 20.3% | 0.37%(+19.9)#25 | 0.61%(+19.6)#437 |
| 26. | Wellman | 18.9% | 0.37%(+18.5)#26 | 0.61%(+18.3)#477 |
| 27. | Gail | 18.2% | 0.37%(+17.8)#27 | 0.61%(+17.6)#502 |
| 28. | Blanket | 17.9% | 0.37%(+17.5)#28 | 0.61%(+17.3)#521 |
| 29. | Kress | 17.3% | 0.37%(+17.0)#29 | 0.61%(+16.7)#542 |
| 30. | Childress | 16.4% | 0.37%(+16.0)#30 | 0.61%(+15.8)#577 |
| 31. | Madisonville | 16.2% | 0.37%(+15.8)#31 | 0.61%(+15.6)#585 |
| 32. | Opdyke West | 15.8% | 0.37%(+15.4)#32 | 0.61%(+15.2)#601 |
| 33. | Texline | 15.5% | 0.37%(+15.1)#33 | 0.61%(+14.8)#614 |
| 34. | Lakeview | 15.4% | 0.37%(+15.0)#34 | 0.61%(+14.8)#626 |
| 35. | Louise | 14.4% | 0.37%(+14.0)#35 | 0.61%(+13.8)#672 |
| 36. | Sabinal | 14.4% | 0.37%(+14.0)#36 | 0.61%(+13.8)#675 |
| 37. | Cotulla | 14.3% | 0.37%(+14.0)#37 | 0.61%(+13.7)#677 |
| 38. | Guthrie | 14.3% | 0.37%(+13.9)#38 | 0.61%(+13.7)#683 |
| 39. | Springlake | 14.3% | 0.37%(+13.9)#39 | 0.61%(+13.7)#688 |
| 40. | Hart | 13.5% | 0.37%(+13.2)#40 | 0.61%(+12.9)#742 |
| 41. | Presidio | 13.5% | 0.37%(+13.2)#41 | 0.61%(+12.9)#743 |
| 42. | Amherst | 13.4% | 0.37%(+13.1)#42 | 0.61%(+12.8)#750 |
| 43. | North Pearsall | 13.2% | 0.37%(+12.9)#43 | 0.61%(+12.6)#764 |
| 44. | Center Point | 13.2% | 0.37%(+12.8)#44 | 0.61%(+12.6)#765 |
| 45. | Edmonson | 13.2% | 0.37%(+12.8)#45 | 0.61%(+12.6)#767 |
| 46. | Plains | 12.7% | 0.37%(+12.4)#46 | 0.61%(+12.1)#802 |
| 47. | Cactus | 12.5% | 0.37%(+12.1)#47 | 0.61%(+11.9)#831 |
| 48. | Batesville | 12.4% | 0.37%(+12.0)#48 | 0.61%(+11.8)#836 |
| 49. | Gruver | 12.1% | 0.37%(+11.7)#49 | 0.61%(+11.5)#864 |
| 50. | Lingleville | 11.9% | 0.37%(+11.6)#50 | 0.61%(+11.3)#874 |
| 51. | Reklaw | 11.8% | 0.37%(+11.4)#51 | 0.61%(+11.2)#882 |
| 52. | Spur | 11.6% | 0.37%(+11.3)#52 | 0.61%(+11.0)#895 |
| 53. | Friona | 11.6% | 0.37%(+11.2)#53 | 0.61%(+11.0)#899 |
| 54. | Sunray | 11.6% | 0.37%(+11.2)#54 | 0.61%(+11.0)#901 |
| 55. | La Pryor | 11.5% | 0.37%(+11.1)#55 | 0.61%(+10.9)#909 |
| 56. | Midway | 11.2% | 0.37%(+10.8)#56 | 0.61%(+10.6)#929 |
| 57. | Rotan | 11.1% | 0.37%(+10.7)#57 | 0.61%(+10.5)#933 |
| 58. | Riviera | 11.1% | 0.37%(+10.7)#58 | 0.61%(+10.5)#934 |
| 59. | Morton | 11.1% | 0.37%(+10.7)#59 | 0.61%(+10.5)#947 |
| 60. | Airport Road Addition | 11.0% | 0.37%(+10.6)#60 | 0.61%(+10.4)#958 |
| 61. | Hedley | 11.0% | 0.37%(+10.6)#61 | 0.61%(+10.4)#960 |
| 62. | Whitharral | 10.8% | 0.37%(+10.4)#62 | 0.61%(+10.2)#972 |
| 63. | Malone | 10.6% | 0.37%(+10.3)#63 | 0.61%(+10.0)#1,000 |
| 64. | Monte Alto | 10.6% | 0.37%(+10.2)#64 | 0.61%(+9.95)#1,005 |
| 65. | Loraine | 10.5% | 0.37%(+10.1)#65 | 0.61%(+9.85)#1,016 |
| 66. | Walnut Springs | 10.3% | 0.37%(+9.90)#66 | 0.61%(+9.67)#1,037 |
| 67. | Cushing | 10.2% | 0.37%(+9.86)#67 | 0.61%(+9.62)#1,047 |
| 68. | Garwood | 10.2% | 0.37%(+9.84)#68 | 0.61%(+9.61)#1,051 |
| 69. | Rochester | 10.0% | 0.37%(+9.63)#69 | 0.61%(+9.39)#1,069 |
| 70. | Tradewinds | 9.9% | 0.37%(+9.56)#70 | 0.61%(+9.32)#1,085 |
| 71. | Hermleigh | 9.8% | 0.37%(+9.46)#71 | 0.61%(+9.23)#1,100 |
| 72. | Pawnee | 9.8% | 0.37%(+9.38)#72 | 0.61%(+9.15)#1,109 |
| 73. | Sebastian | 9.7% | 0.37%(+9.31)#73 | 0.61%(+9.07)#1,117 |
| 74. | South Toledo Bend | 9.4% | 0.37%(+9.06)#74 | 0.61%(+8.83)#1,162 |
| 75. | New Summerfield | 9.4% | 0.37%(+9.06)#75 | 0.61%(+8.82)#1,164 |
| 76. | Howardwick | 9.1% | 0.37%(+8.72)#76 | 0.61%(+8.49)#1,206 |
| 77. | Floydada | 9.0% | 0.37%(+8.58)#77 | 0.61%(+8.35)#1,240 |
| 78. | Earth | 8.9% | 0.37%(+8.53)#78 | 0.61%(+8.29)#1,251 |
| 79. | Moore Station | 8.8% | 0.37%(+8.45)#79 | 0.61%(+8.22)#1,262 |
| 80. | Spearman | 8.8% | 0.37%(+8.42)#80 | 0.61%(+8.19)#1,269 |
| 81. | San Ygnacio | 8.6% | 0.37%(+8.26)#81 | 0.61%(+8.02)#1,295 |
| 82. | Clarendon | 8.6% | 0.37%(+8.19)#82 | 0.61%(+7.96)#1,312 |
| 83. | Fort Hancock | 8.5% | 0.37%(+8.09)#83 | 0.61%(+7.86)#1,329 |
| 84. | Smiley | 8.1% | 0.37%(+7.77)#84 | 0.61%(+7.53)#1,395 |
| 85. | Bayside | 8.1% | 0.37%(+7.75)#85 | 0.61%(+7.52)#1,399 |
| 86. | Boling | 8.1% | 0.37%(+7.73)#86 | 0.61%(+7.50)#1,404 |
| 87. | Strawn | 8.1% | 0.37%(+7.71)#87 | 0.61%(+7.48)#1,411 |
| 88. | Round Top | 8.1% | 0.37%(+7.69)#88 | 0.61%(+7.46)#1,417 |
| 89. | Palo Pinto | 8.0% | 0.37%(+7.63)#89 | 0.61%(+7.39)#1,431 |
| 90. | Meadow | 8.0% | 0.37%(+7.61)#90 | 0.61%(+7.37)#1,435 |
| 91. | Windthorst | 8.0% | 0.37%(+7.60)#91 | 0.61%(+7.37)#1,436 |
| 92. | Huxley | 7.9% | 0.37%(+7.48)#92 | 0.61%(+7.25)#1,462 |
| 93. | Redfield | 7.8% | 0.37%(+7.41)#93 | 0.61%(+7.17)#1,478 |
| 94. | Canadian | 7.7% | 0.37%(+7.33)#94 | 0.61%(+7.09)#1,489 |
| 95. | Indian Lake | 7.4% | 0.37%(+7.05)#95 | 0.61%(+6.82)#1,564 |
| 96. | Estelline | 7.3% | 0.37%(+6.94)#96 | 0.61%(+6.71)#1,591 |
| 97. | O Donnell | 7.2% | 0.37%(+6.86)#97 | 0.61%(+6.63)#1,608 |
| 98. | Miles | 7.1% | 0.37%(+6.77)#98 | 0.61%(+6.54)#1,620 |
| 99. | Las Lomas | 7.1% | 0.37%(+6.74)#99 | 0.61%(+6.51)#1,640 |
| 100. | Normangee | 6.9% | 0.37%(+6.49)#100 | 0.61%(+6.26)#1,699 |
Common Questions
What are the Top 10 Cities with the Highest Percentage of Population Employed in Farming, Fishing & Forestry in Texas?
Top 10 Cities with the Highest Percentage of Population Employed in Farming, Fishing & Forestry in Texas are:
#1
79.2%
#2
59.6%
#3
41.9%
#4
33.0%
#5
32.6%
#6
30.8%
#7
30.7%
#8
29.9%
#9
28.6%
#10
26.9%
What city has the Highest Percentage of Population Employed in Farming, Fishing & Forestry in Texas?
Los Angeles has the Highest Percentage of Population Employed in Farming, Fishing & Forestry in Texas with 79.2%.
What is the Percentage of Population Employed in Farming, Fishing & Forestry in the State of Texas?
Percentage of Population Employed in Farming, Fishing & Forestry in Texas is 0.37%.
What is the Percentage of Population Employed in Farming, Fishing & Forestry in the United States?
Percentage of Population Employed in Farming, Fishing & Forestry in the United States is 0.61%.