Cities with the Highest Percentage of Population Employed in Farming, Fishing & Forestry in Oregon
RELATED REPORTS & OPTIONS
Farming, Fishing & Forestry
Oregon
Compare Cities
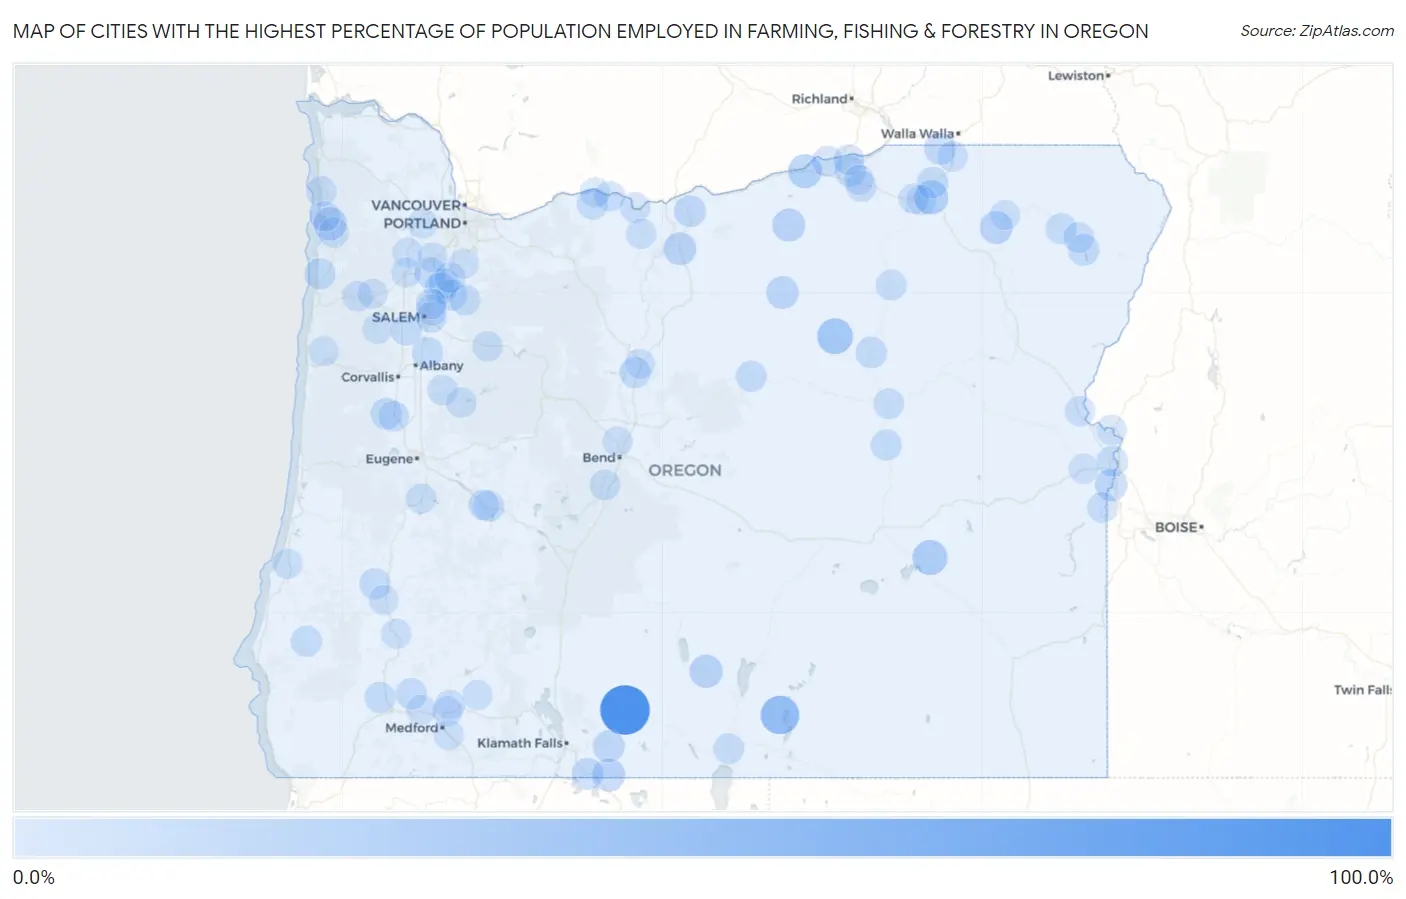
Map of Cities with the Highest Percentage of Population Employed in Farming, Fishing & Forestry in Oregon
0.0%
100.0%
Cities with the Highest Percentage of Population Employed in Farming, Fishing & Forestry in Oregon
| City | % Employed | vs State | vs National | |
| 1. | Beatty | 100.0% | 1.4%(+98.6)#1 | 0.61%(+99.4)#15 |
| 2. | Plush | 43.9% | 1.4%(+42.5)#2 | 0.61%(+43.3)#104 |
| 3. | Gilchrist | 38.4% | 1.4%(+36.9)#3 | 0.61%(+37.8)#136 |
| 4. | Monument | 29.5% | 1.4%(+28.1)#4 | 0.61%(+28.9)#228 |
| 5. | Crane | 25.6% | 1.4%(+24.1)#5 | 0.61%(+25.0)#315 |
| 6. | Cayuse | 21.1% | 1.4%(+19.6)#6 | 0.61%(+20.4)#412 |
| 7. | Boardman | 20.5% | 1.4%(+19.1)#7 | 0.61%(+19.9)#426 |
| 8. | Idaville | 17.9% | 1.4%(+16.5)#8 | 0.61%(+17.3)#517 |
| 9. | Paisley | 17.3% | 1.4%(+15.9)#9 | 0.61%(+16.7)#543 |
| 10. | Ione | 16.1% | 1.4%(+14.7)#10 | 0.61%(+15.5)#592 |
| 11. | Malin | 15.8% | 1.4%(+14.4)#11 | 0.61%(+15.2)#600 |
| 12. | Summerville | 15.3% | 1.4%(+13.8)#12 | 0.61%(+14.6)#632 |
| 13. | Grass Valley | 15.0% | 1.4%(+13.6)#13 | 0.61%(+14.4)#641 |
| 14. | Lonerock | 14.3% | 1.4%(+12.9)#14 | 0.61%(+13.7)#696 |
| 15. | Nyssa | 13.2% | 1.4%(+11.8)#15 | 0.61%(+12.6)#774 |
| 16. | Wasco | 10.9% | 1.4%(+9.53)#16 | 0.61%(+10.3)#963 |
| 17. | Bonanza | 10.8% | 1.4%(+9.36)#17 | 0.61%(+10.2)#982 |
| 18. | Umapine | 10.7% | 1.4%(+9.27)#18 | 0.61%(+10.1)#996 |
| 19. | Merrill | 10.5% | 1.4%(+9.12)#19 | 0.61%(+9.92)#1,007 |
| 20. | Gervais | 9.5% | 1.4%(+8.12)#20 | 0.61%(+8.92)#1,139 |
| 21. | Alpine | 9.4% | 1.4%(+8.03)#21 | 0.61%(+8.83)#1,163 |
| 22. | Long Creek | 9.1% | 1.4%(+7.68)#22 | 0.61%(+8.49)#1,209 |
| 23. | Mount Angel | 9.1% | 1.4%(+7.65)#23 | 0.61%(+8.46)#1,217 |
| 24. | Adams | 8.9% | 1.4%(+7.47)#24 | 0.61%(+8.27)#1,255 |
| 25. | Metolius | 8.6% | 1.4%(+7.14)#25 | 0.61%(+7.95)#1,313 |
| 26. | Joseph | 8.5% | 1.4%(+7.07)#26 | 0.61%(+7.87)#1,322 |
| 27. | Odell | 8.3% | 1.4%(+6.88)#27 | 0.61%(+7.68)#1,372 |
| 28. | Jefferson | 8.2% | 1.4%(+6.81)#28 | 0.61%(+7.61)#1,380 |
| 29. | Melrose | 7.9% | 1.4%(+6.44)#29 | 0.61%(+7.25)#1,463 |
| 30. | San Marine | 7.7% | 1.4%(+6.31)#30 | 0.61%(+7.12)#1,486 |
| 31. | Pacific City | 7.6% | 1.4%(+6.15)#31 | 0.61%(+6.95)#1,532 |
| 32. | Wimer | 7.5% | 1.4%(+6.08)#32 | 0.61%(+6.88)#1,548 |
| 33. | Lostine | 7.4% | 1.4%(+6.02)#33 | 0.61%(+6.83)#1,561 |
| 34. | St Paul | 7.4% | 1.4%(+6.00)#34 | 0.61%(+6.80)#1,567 |
| 35. | Powers | 7.4% | 1.4%(+5.98)#35 | 0.61%(+6.79)#1,576 |
| 36. | Ontario | 7.2% | 1.4%(+5.84)#36 | 0.61%(+6.64)#1,603 |
| 37. | Woodburn | 7.1% | 1.4%(+5.74)#37 | 0.61%(+6.54)#1,619 |
| 38. | Oakridge | 7.1% | 1.4%(+5.68)#38 | 0.61%(+6.48)#1,644 |
| 39. | Hermiston | 7.0% | 1.4%(+5.58)#39 | 0.61%(+6.39)#1,667 |
| 40. | Mitchell | 6.9% | 1.4%(+5.54)#40 | 0.61%(+6.34)#1,680 |
| 41. | Independence | 6.9% | 1.4%(+5.50)#41 | 0.61%(+6.30)#1,687 |
| 42. | Seneca | 6.9% | 1.4%(+5.49)#42 | 0.61%(+6.29)#1,693 |
| 43. | Merlin | 6.8% | 1.4%(+5.38)#43 | 0.61%(+6.18)#1,713 |
| 44. | Echo | 6.7% | 1.4%(+5.26)#44 | 0.61%(+6.06)#1,739 |
| 45. | Ukiah | 6.5% | 1.4%(+5.11)#45 | 0.61%(+5.92)#1,782 |
| 46. | Enterprise | 6.4% | 1.4%(+4.98)#46 | 0.61%(+5.78)#1,812 |
| 47. | Irrigon | 6.4% | 1.4%(+4.96)#47 | 0.61%(+5.76)#1,817 |
| 48. | Lakeview | 6.2% | 1.4%(+4.84)#48 | 0.61%(+5.64)#1,855 |
| 49. | Scotts Mills | 6.2% | 1.4%(+4.77)#49 | 0.61%(+5.57)#1,864 |
| 50. | Hayesville | 6.0% | 1.4%(+4.62)#50 | 0.61%(+5.43)#1,917 |
| 51. | Bayshore | 5.9% | 1.4%(+4.53)#51 | 0.61%(+5.34)#1,942 |
| 52. | Sunriver | 5.8% | 1.4%(+4.41)#52 | 0.61%(+5.22)#1,982 |
| 53. | Monroe | 5.7% | 1.4%(+4.25)#53 | 0.61%(+5.05)#2,034 |
| 54. | Umatilla | 5.6% | 1.4%(+4.23)#54 | 0.61%(+5.03)#2,039 |
| 55. | Westfir | 5.5% | 1.4%(+4.10)#55 | 0.61%(+4.91)#2,093 |
| 56. | Adrian | 5.4% | 1.4%(+3.97)#56 | 0.61%(+4.77)#2,161 |
| 57. | Canyon City | 5.2% | 1.4%(+3.83)#57 | 0.61%(+4.63)#2,214 |
| 58. | Four Corners | 5.2% | 1.4%(+3.81)#58 | 0.61%(+4.61)#2,219 |
| 59. | Grand Ronde | 5.0% | 1.4%(+3.63)#59 | 0.61%(+4.43)#2,287 |
| 60. | Hubbard | 5.0% | 1.4%(+3.55)#60 | 0.61%(+4.35)#2,322 |
| 61. | Sodaville | 4.9% | 1.4%(+3.52)#61 | 0.61%(+4.32)#2,333 |
| 62. | Gopher Flats | 4.9% | 1.4%(+3.49)#62 | 0.61%(+4.29)#2,346 |
| 63. | Milton Freewater | 4.8% | 1.4%(+3.42)#63 | 0.61%(+4.22)#2,384 |
| 64. | Manzanita | 4.7% | 1.4%(+3.26)#64 | 0.61%(+4.06)#2,456 |
| 65. | Tillamook | 4.6% | 1.4%(+3.23)#65 | 0.61%(+4.03)#2,471 |
| 66. | Sweet Home | 4.2% | 1.4%(+2.82)#66 | 0.61%(+3.62)#2,685 |
| 67. | The Dalles | 4.0% | 1.4%(+2.64)#67 | 0.61%(+3.44)#2,795 |
| 68. | Garibaldi | 4.0% | 1.4%(+2.63)#68 | 0.61%(+3.43)#2,796 |
| 69. | Labish Village | 4.0% | 1.4%(+2.61)#69 | 0.61%(+3.41)#2,814 |
| 70. | Mill City | 4.0% | 1.4%(+2.55)#70 | 0.61%(+3.35)#2,855 |
| 71. | Cottage Grove | 3.9% | 1.4%(+2.47)#71 | 0.61%(+3.27)#2,914 |
| 72. | Huntington | 3.7% | 1.4%(+2.33)#72 | 0.61%(+3.13)#3,007 |
| 73. | Dufur | 3.7% | 1.4%(+2.32)#73 | 0.61%(+3.12)#3,020 |
| 74. | Annex | 3.6% | 1.4%(+2.14)#74 | 0.61%(+2.94)#3,181 |
| 75. | Mosier | 3.5% | 1.4%(+2.12)#75 | 0.61%(+2.92)#3,193 |
| 76. | Eagle Point | 3.5% | 1.4%(+2.10)#76 | 0.61%(+2.91)#3,207 |
| 77. | Coos Bay | 3.5% | 1.4%(+2.10)#77 | 0.61%(+2.90)#3,217 |
| 78. | Vale | 3.4% | 1.4%(+2.00)#78 | 0.61%(+2.80)#3,283 |
| 79. | Hood River | 3.4% | 1.4%(+1.99)#79 | 0.61%(+2.80)#3,288 |
| 80. | Gold Hill | 3.4% | 1.4%(+1.96)#80 | 0.61%(+2.76)#3,314 |
| 81. | Siletz | 3.3% | 1.4%(+1.93)#81 | 0.61%(+2.73)#3,329 |
| 82. | Canyonville | 3.2% | 1.4%(+1.80)#82 | 0.61%(+2.60)#3,454 |
| 83. | Canby | 3.2% | 1.4%(+1.77)#83 | 0.61%(+2.57)#3,470 |
| 84. | Green | 3.2% | 1.4%(+1.77)#84 | 0.61%(+2.57)#3,480 |
| 85. | White City | 3.1% | 1.4%(+1.67)#85 | 0.61%(+2.48)#3,567 |
| 86. | Butte Falls | 3.0% | 1.4%(+1.64)#86 | 0.61%(+2.44)#3,599 |
| 87. | Newberg | 3.0% | 1.4%(+1.63)#87 | 0.61%(+2.43)#3,603 |
| 88. | Yamhill | 3.0% | 1.4%(+1.54)#88 | 0.61%(+2.35)#3,686 |
| 89. | Tumalo | 2.9% | 1.4%(+1.49)#89 | 0.61%(+2.29)#3,741 |
| 90. | Falls City | 2.9% | 1.4%(+1.47)#90 | 0.61%(+2.27)#3,756 |
| 91. | Madras | 2.9% | 1.4%(+1.47)#91 | 0.61%(+2.27)#3,763 |
| 92. | Phoenix | 2.9% | 1.4%(+1.44)#92 | 0.61%(+2.25)#3,797 |
| 93. | Mcminnville | 2.8% | 1.4%(+1.44)#93 | 0.61%(+2.24)#3,801 |
| 94. | Saunders Lake | 2.8% | 1.4%(+1.42)#94 | 0.61%(+2.22)#3,820 |
| 95. | Willamina | 2.7% | 1.4%(+1.32)#95 | 0.61%(+2.12)#3,932 |
| 96. | Mission | 2.7% | 1.4%(+1.30)#96 | 0.61%(+2.10)#3,953 |
| 97. | Cornelius | 2.7% | 1.4%(+1.29)#97 | 0.61%(+2.10)#3,964 |
| 98. | Elgin | 2.7% | 1.4%(+1.29)#98 | 0.61%(+2.09)#3,965 |
| 99. | Knappa | 2.7% | 1.4%(+1.27)#99 | 0.61%(+2.07)#3,993 |
| 100. | Stanfield | 2.7% | 1.4%(+1.27)#100 | 0.61%(+2.07)#3,995 |
Common Questions
What are the Top 10 Cities with the Highest Percentage of Population Employed in Farming, Fishing & Forestry in Oregon?
Top 10 Cities with the Highest Percentage of Population Employed in Farming, Fishing & Forestry in Oregon are:
What city has the Highest Percentage of Population Employed in Farming, Fishing & Forestry in Oregon?
Beatty has the Highest Percentage of Population Employed in Farming, Fishing & Forestry in Oregon with 100.0%.
What is the Percentage of Population Employed in Farming, Fishing & Forestry in the State of Oregon?
Percentage of Population Employed in Farming, Fishing & Forestry in Oregon is 1.4%.
What is the Percentage of Population Employed in Farming, Fishing & Forestry in the United States?
Percentage of Population Employed in Farming, Fishing & Forestry in the United States is 0.61%.