Cities with the Highest Percentage of Population Employed in Farming, Fishing & Forestry in Virginia
RELATED REPORTS & OPTIONS
Farming, Fishing & Forestry
Virginia
Compare Cities
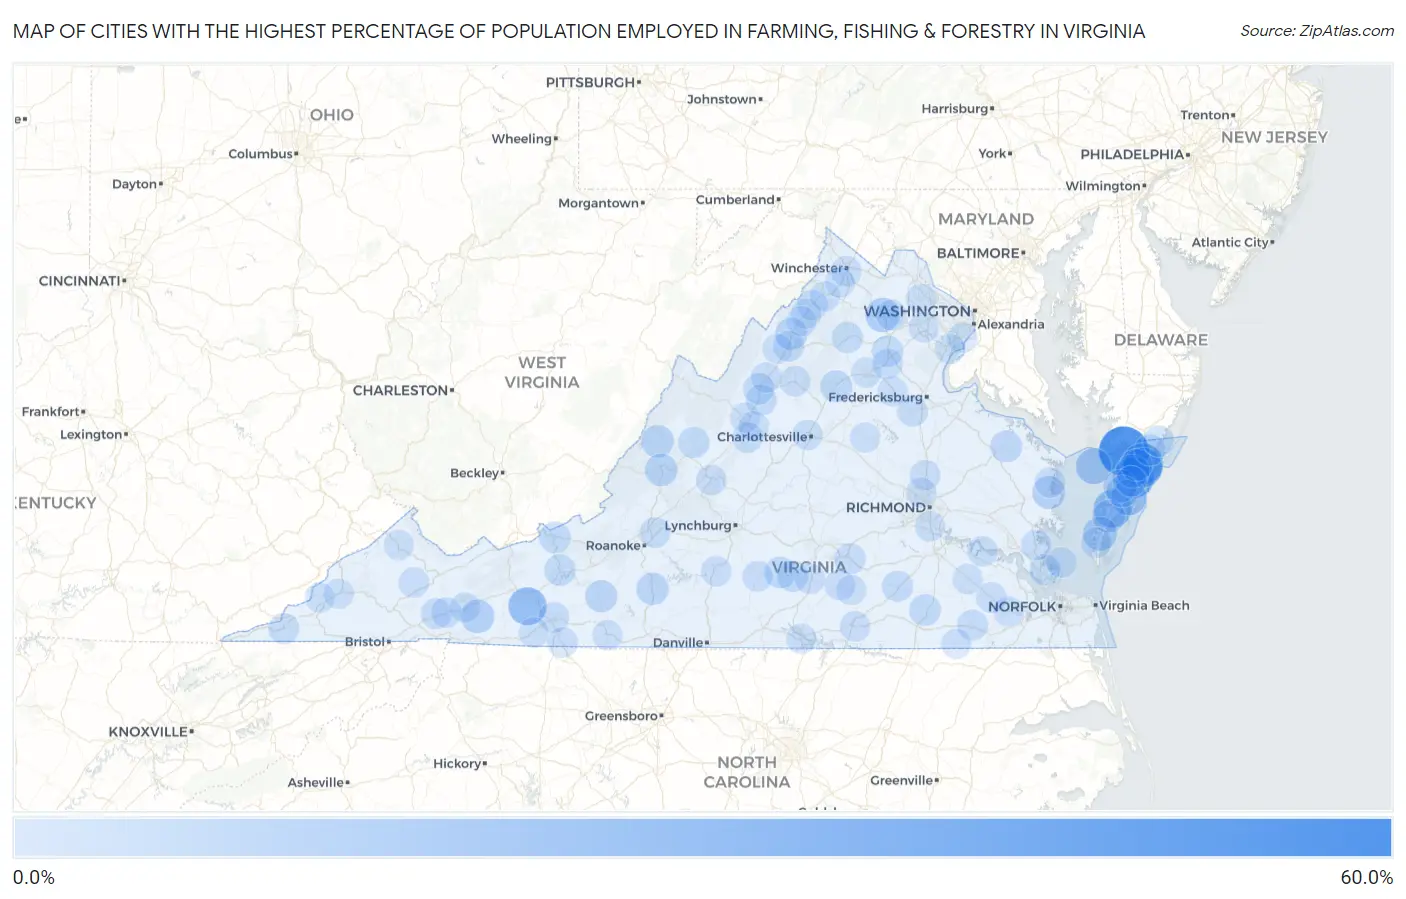
Map of Cities with the Highest Percentage of Population Employed in Farming, Fishing & Forestry in Virginia
0.0%
60.0%
Cities with the Highest Percentage of Population Employed in Farming, Fishing & Forestry in Virginia
| City | % Employed | vs State | vs National | |
| 1. | Saxis | 50.5% | 0.33%(+50.2)#1 | 0.61%(+49.9)#75 |
| 2. | Osaka | 36.4% | 0.33%(+36.0)#2 | 0.61%(+35.8)#154 |
| 3. | Mappsville | 28.9% | 0.33%(+28.6)#3 | 0.61%(+28.3)#239 |
| 4. | Pastoria | 28.1% | 0.33%(+27.8)#4 | 0.61%(+27.5)#254 |
| 5. | Modest Town | 24.7% | 0.33%(+24.4)#5 | 0.61%(+24.1)#329 |
| 6. | Ivanhoe | 20.3% | 0.33%(+20.0)#6 | 0.61%(+19.7)#433 |
| 7. | Exmore | 20.0% | 0.33%(+19.7)#7 | 0.61%(+19.4)#441 |
| 8. | Tangier | 14.5% | 0.33%(+14.2)#8 | 0.61%(+13.9)#667 |
| 9. | Wachapreague | 14.3% | 0.33%(+14.0)#9 | 0.61%(+13.7)#680 |
| 10. | Marshall | 10.7% | 0.33%(+10.4)#10 | 0.61%(+10.1)#989 |
| 11. | Eastville | 10.1% | 0.33%(+9.79)#11 | 0.61%(+9.51)#1,056 |
| 12. | Sugar Grove | 8.8% | 0.33%(+8.51)#12 | 0.61%(+8.24)#1,258 |
| 13. | Savageville | 8.0% | 0.33%(+7.63)#13 | 0.61%(+7.35)#1,439 |
| 14. | Parksley | 7.9% | 0.33%(+7.62)#14 | 0.61%(+7.34)#1,444 |
| 15. | White Stone | 7.5% | 0.33%(+7.22)#15 | 0.61%(+6.94)#1,535 |
| 16. | Nassawadox | 6.8% | 0.33%(+6.43)#16 | 0.61%(+6.15)#1,719 |
| 17. | Hot Springs | 6.3% | 0.33%(+6.02)#17 | 0.61%(+5.74)#1,818 |
| 18. | Iron Gate | 6.1% | 0.33%(+5.73)#18 | 0.61%(+5.46)#1,905 |
| 19. | Henry Fork | 5.9% | 0.33%(+5.60)#19 | 0.61%(+5.32)#1,948 |
| 20. | Floyd | 5.5% | 0.33%(+5.15)#20 | 0.61%(+4.87)#2,109 |
| 21. | Mount Jackson | 5.2% | 0.33%(+4.91)#21 | 0.61%(+4.64)#2,210 |
| 22. | Bloxom | 5.2% | 0.33%(+4.84)#22 | 0.61%(+4.57)#2,233 |
| 23. | Melfa | 4.9% | 0.33%(+4.54)#23 | 0.61%(+4.26)#2,363 |
| 24. | Madison | 4.5% | 0.33%(+4.19)#24 | 0.61%(+3.91)#2,533 |
| 25. | Warsaw | 4.4% | 0.33%(+4.07)#25 | 0.61%(+3.79)#2,589 |
| 26. | Jarratt | 4.2% | 0.33%(+3.84)#26 | 0.61%(+3.56)#2,718 |
| 27. | Phenix | 4.0% | 0.33%(+3.64)#27 | 0.61%(+3.37)#2,837 |
| 28. | Pearisburg | 3.9% | 0.33%(+3.60)#28 | 0.61%(+3.32)#2,879 |
| 29. | Dublin | 3.6% | 0.33%(+3.28)#29 | 0.61%(+3.00)#3,124 |
| 30. | Opal | 3.4% | 0.33%(+3.03)#30 | 0.61%(+2.75)#3,318 |
| 31. | Mount Crawford | 3.2% | 0.33%(+2.91)#31 | 0.61%(+2.63)#3,426 |
| 32. | Goshen | 3.1% | 0.33%(+2.80)#32 | 0.61%(+2.52)#3,527 |
| 33. | Charlotte Court House | 3.1% | 0.33%(+2.76)#33 | 0.61%(+2.48)#3,562 |
| 34. | Washington | 2.9% | 0.33%(+2.61)#34 | 0.61%(+2.34)#3,706 |
| 35. | Wattsville | 2.9% | 0.33%(+2.58)#35 | 0.61%(+2.30)#3,733 |
| 36. | Captains Cove | 2.8% | 0.33%(+2.50)#36 | 0.61%(+2.22)#3,823 |
| 37. | Mckenney | 2.6% | 0.33%(+2.26)#37 | 0.61%(+1.99)#4,091 |
| 38. | Bethel Manor | 2.6% | 0.33%(+2.26)#38 | 0.61%(+1.98)#4,100 |
| 39. | Crewe | 2.4% | 0.33%(+2.04)#39 | 0.61%(+1.76)#4,366 |
| 40. | Weyers Cave | 2.3% | 0.33%(+2.00)#40 | 0.61%(+1.73)#4,414 |
| 41. | Spotsylvania Courthouse | 2.3% | 0.33%(+1.97)#41 | 0.61%(+1.69)#4,441 |
| 42. | Courtland | 2.3% | 0.33%(+1.95)#42 | 0.61%(+1.67)#4,463 |
| 43. | Glade Spring | 2.2% | 0.33%(+1.92)#43 | 0.61%(+1.64)#4,512 |
| 44. | New Market | 2.2% | 0.33%(+1.91)#44 | 0.61%(+1.64)#4,517 |
| 45. | Hillsville | 2.2% | 0.33%(+1.88)#45 | 0.61%(+1.61)#4,558 |
| 46. | Jonesville | 2.2% | 0.33%(+1.83)#46 | 0.61%(+1.55)#4,632 |
| 47. | Laymantown | 1.9% | 0.33%(+1.56)#47 | 0.61%(+1.28)#5,048 |
| 48. | Buena Vista | 1.7% | 0.33%(+1.37)#48 | 0.61%(+1.09)#5,358 |
| 49. | Meadowview | 1.7% | 0.33%(+1.37)#49 | 0.61%(+1.09)#5,372 |
| 50. | Accomac | 1.7% | 0.33%(+1.36)#50 | 0.61%(+1.08)#5,382 |
| 51. | Brookneal | 1.7% | 0.33%(+1.33)#51 | 0.61%(+1.06)#5,432 |
| 52. | Remington | 1.6% | 0.33%(+1.31)#52 | 0.61%(+1.03)#5,481 |
| 53. | Ivor | 1.6% | 0.33%(+1.28)#53 | 0.61%(+1.01)#5,534 |
| 54. | Honaker | 1.6% | 0.33%(+1.23)#54 | 0.61%(+0.953)#5,649 |
| 55. | Elkton | 1.5% | 0.33%(+1.20)#55 | 0.61%(+0.920)#5,709 |
| 56. | Maurertown | 1.5% | 0.33%(+1.16)#56 | 0.61%(+0.884)#5,783 |
| 57. | Cheriton | 1.4% | 0.33%(+1.11)#57 | 0.61%(+0.837)#5,890 |
| 58. | Winchester | 1.4% | 0.33%(+1.06)#58 | 0.61%(+0.786)#5,993 |
| 59. | Stuarts Draft | 1.3% | 0.33%(+1.02)#59 | 0.61%(+0.742)#6,090 |
| 60. | La Crosse | 1.3% | 0.33%(+1.02)#60 | 0.61%(+0.740)#6,096 |
| 61. | The Plains | 1.3% | 0.33%(+1.01)#61 | 0.61%(+0.737)#6,107 |
| 62. | Poquoson | 1.3% | 0.33%(+1.00)#62 | 0.61%(+0.724)#6,139 |
| 63. | Hurt | 1.3% | 0.33%(+0.960)#63 | 0.61%(+0.684)#6,240 |
| 64. | Harrisonburg | 1.3% | 0.33%(+0.939)#64 | 0.61%(+0.662)#6,292 |
| 65. | Keysville | 1.3% | 0.33%(+0.937)#65 | 0.61%(+0.660)#6,297 |
| 66. | Victoria | 1.3% | 0.33%(+0.931)#66 | 0.61%(+0.654)#6,321 |
| 67. | Gloucester Point | 1.2% | 0.33%(+0.895)#67 | 0.61%(+0.619)#6,409 |
| 68. | Cana | 1.2% | 0.33%(+0.825)#68 | 0.61%(+0.548)#6,587 |
| 69. | Chilhowie | 1.1% | 0.33%(+0.773)#69 | 0.61%(+0.496)#6,735 |
| 70. | Claremont | 1.1% | 0.33%(+0.770)#70 | 0.61%(+0.493)#6,745 |
| 71. | Woodstock | 1.1% | 0.33%(+0.739)#71 | 0.61%(+0.462)#6,829 |
| 72. | Ashland | 1.1% | 0.33%(+0.723)#72 | 0.61%(+0.446)#6,884 |
| 73. | Kilmarnock | 0.95% | 0.33%(+0.626)#73 | 0.61%(+0.349)#7,164 |
| 74. | University Of Virginia | 0.93% | 0.33%(+0.599)#74 | 0.61%(+0.323)#7,256 |
| 75. | Fort Belvoir | 0.85% | 0.33%(+0.523)#75 | 0.61%(+0.246)#7,509 |
| 76. | Grundy | 0.85% | 0.33%(+0.519)#76 | 0.61%(+0.242)#7,525 |
| 77. | Boykins | 0.81% | 0.33%(+0.484)#77 | 0.61%(+0.207)#7,664 |
| 78. | Norton | 0.80% | 0.33%(+0.468)#78 | 0.61%(+0.192)#7,723 |
| 79. | Timberville | 0.74% | 0.33%(+0.412)#79 | 0.61%(+0.136)#7,935 |
| 80. | Waverly | 0.74% | 0.33%(+0.407)#80 | 0.61%(+0.130)#7,953 |
| 81. | Strasburg | 0.73% | 0.33%(+0.404)#81 | 0.61%(+0.128)#7,964 |
| 82. | Staunton | 0.72% | 0.33%(+0.391)#82 | 0.61%(+0.114)#8,015 |
| 83. | Woodbridge | 0.71% | 0.33%(+0.383)#83 | 0.61%(+0.107)#8,044 |
| 84. | Loudoun Valley Estates | 0.68% | 0.33%(+0.353)#84 | 0.61%(+0.076)#8,169 |
| 85. | Louisa | 0.68% | 0.33%(+0.350)#85 | 0.61%(+0.073)#8,179 |
| 86. | Edinburg | 0.66% | 0.33%(+0.328)#86 | 0.61%(+0.051)#8,263 |
| 87. | Stephens City | 0.66% | 0.33%(+0.327)#87 | 0.61%(+0.050)#8,267 |
| 88. | Galax | 0.61% | 0.33%(+0.279)#88 | 0.61%(+0.002)#8,461 |
| 89. | Windsor | 0.59% | 0.33%(+0.264)#89 | 0.61%(-0.013)#8,536 |
| 90. | Appalachia | 0.59% | 0.33%(+0.259)#90 | 0.61%(-0.017)#8,554 |
| 91. | Clarksville | 0.58% | 0.33%(+0.251)#91 | 0.61%(-0.025)#8,585 |
| 92. | Laurel | 0.56% | 0.33%(+0.232)#92 | 0.61%(-0.045)#8,678 |
| 93. | Fishersville | 0.56% | 0.33%(+0.231)#93 | 0.61%(-0.045)#8,680 |
| 94. | Culpeper | 0.54% | 0.33%(+0.212)#94 | 0.61%(-0.065)#8,782 |
| 95. | Marion | 0.53% | 0.33%(+0.200)#95 | 0.61%(-0.077)#8,836 |
| 96. | Bellwood | 0.52% | 0.33%(+0.189)#96 | 0.61%(-0.087)#8,890 |
| 97. | Lake Of The Woods | 0.51% | 0.33%(+0.179)#97 | 0.61%(-0.098)#8,934 |
| 98. | Loch Lomond | 0.51% | 0.33%(+0.178)#98 | 0.61%(-0.098)#8,939 |
| 99. | Kenbridge | 0.48% | 0.33%(+0.147)#99 | 0.61%(-0.129)#9,109 |
| 100. | Stuart | 0.47% | 0.33%(+0.143)#100 | 0.61%(-0.134)#9,134 |
Common Questions
What are the Top 10 Cities with the Highest Percentage of Population Employed in Farming, Fishing & Forestry in Virginia?
Top 10 Cities with the Highest Percentage of Population Employed in Farming, Fishing & Forestry in Virginia are:
#1
50.5%
#2
28.9%
#3
28.1%
#4
24.7%
#5
20.3%
#6
20.0%
#7
14.5%
#8
14.3%
#9
10.7%
#10
10.1%
What city has the Highest Percentage of Population Employed in Farming, Fishing & Forestry in Virginia?
Saxis has the Highest Percentage of Population Employed in Farming, Fishing & Forestry in Virginia with 50.5%.
What is the Percentage of Population Employed in Farming, Fishing & Forestry in the State of Virginia?
Percentage of Population Employed in Farming, Fishing & Forestry in Virginia is 0.33%.
What is the Percentage of Population Employed in Farming, Fishing & Forestry in the United States?
Percentage of Population Employed in Farming, Fishing & Forestry in the United States is 0.61%.