Cities with the Highest Percentage of Population Employed in Farming, Fishing & Forestry in Oklahoma
RELATED REPORTS & OPTIONS
Farming, Fishing & Forestry
Oklahoma
Compare Cities
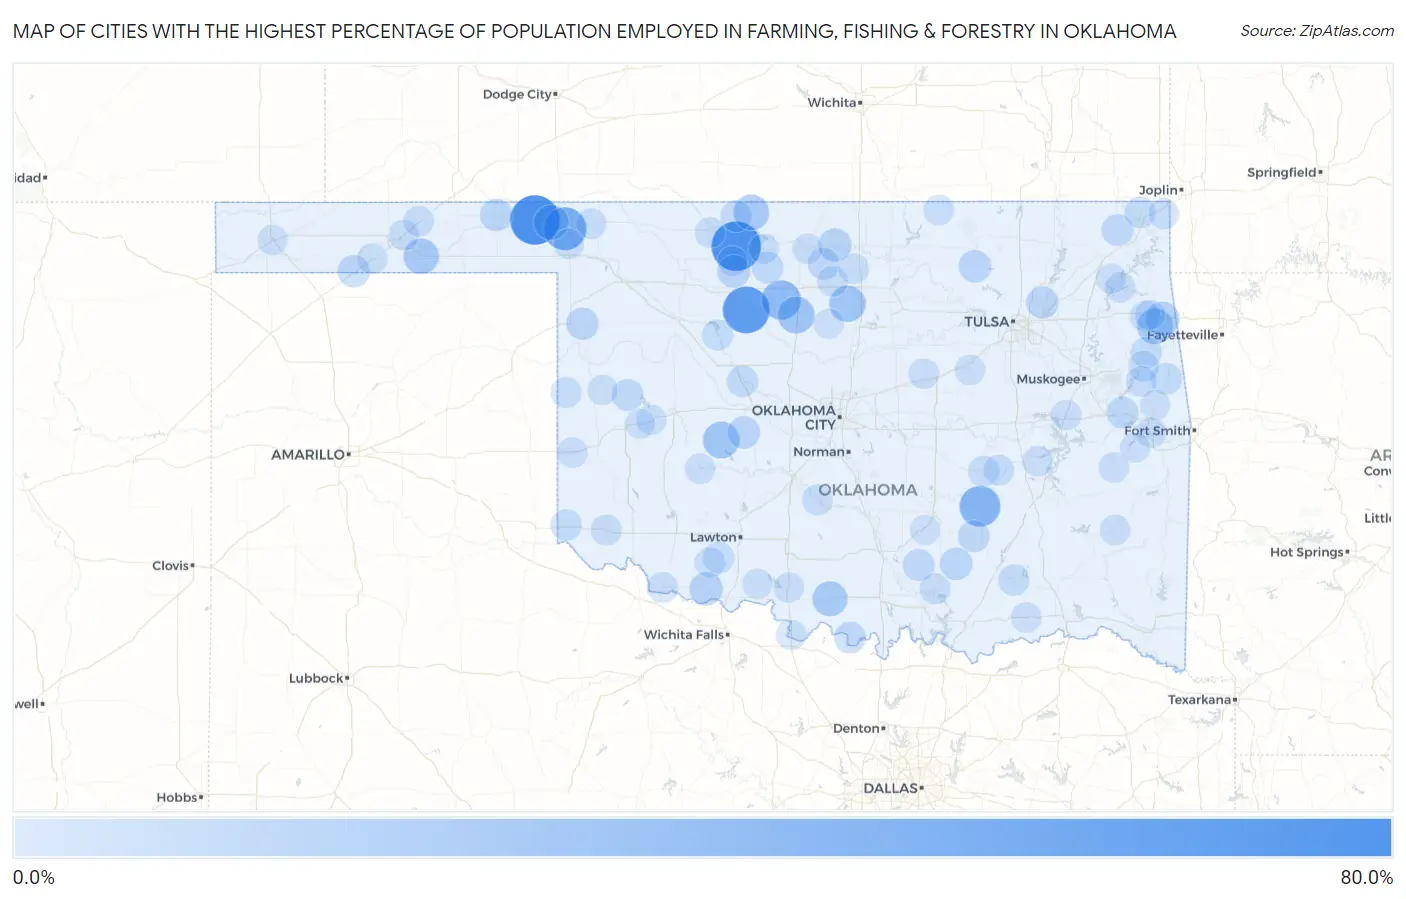
Map of Cities with the Highest Percentage of Population Employed in Farming, Fishing & Forestry in Oklahoma
0.0%
80.0%
Cities with the Highest Percentage of Population Employed in Farming, Fishing & Forestry in Oklahoma
| City | % Employed | vs State | vs National | |
| 1. | Knowles | 75.0% | 0.66%(+74.3)#1 | 0.61%(+74.4)#30 |
| 2. | Lambert | 75.0% | 0.66%(+74.3)#2 | 0.61%(+74.4)#31 |
| 3. | Isabella | 64.5% | 0.66%(+63.9)#3 | 0.61%(+63.9)#40 |
| 4. | Rosston | 50.0% | 0.66%(+49.3)#4 | 0.61%(+49.4)#79 |
| 5. | Gerty | 42.3% | 0.66%(+41.6)#5 | 0.61%(+41.7)#110 |
| 6. | Drummond | 36.8% | 0.66%(+36.1)#6 | 0.61%(+36.2)#151 |
| 7. | Chance | 34.4% | 0.66%(+33.7)#7 | 0.61%(+33.8)#168 |
| 8. | Bison | 27.8% | 0.66%(+27.1)#8 | 0.61%(+27.2)#260 |
| 9. | Eakly | 27.0% | 0.66%(+26.3)#9 | 0.61%(+26.4)#278 |
| 10. | Lucien | 25.9% | 0.66%(+25.3)#10 | 0.61%(+25.3)#304 |
| 11. | Chewey | 24.1% | 0.66%(+23.5)#11 | 0.61%(+23.5)#336 |
| 12. | Amorita | 23.1% | 0.66%(+22.4)#12 | 0.61%(+22.5)#360 |
| 13. | Hardesty | 22.8% | 0.66%(+22.1)#13 | 0.61%(+22.2)#368 |
| 14. | Cornish | 21.2% | 0.66%(+20.5)#14 | 0.61%(+20.5)#407 |
| 15. | Gate | 20.5% | 0.66%(+19.8)#15 | 0.61%(+19.8)#429 |
| 16. | Little Rock | 17.5% | 0.66%(+16.8)#16 | 0.61%(+16.9)#537 |
| 17. | Dripping Springs | 17.4% | 0.66%(+16.7)#17 | 0.61%(+16.8)#540 |
| 18. | Grandfield | 15.0% | 0.66%(+14.4)#18 | 0.61%(+14.4)#640 |
| 19. | Lamont | 14.5% | 0.66%(+13.9)#19 | 0.61%(+13.9)#666 |
| 20. | Aline | 13.6% | 0.66%(+12.9)#20 | 0.61%(+13.0)#740 |
| 21. | Lone Chimney | 12.8% | 0.66%(+12.2)#21 | 0.61%(+12.2)#800 |
| 22. | Wynona | 12.4% | 0.66%(+11.7)#22 | 0.61%(+11.8)#837 |
| 23. | Lookeba | 12.2% | 0.66%(+11.5)#23 | 0.61%(+11.6)#850 |
| 24. | Forgan | 11.7% | 0.66%(+11.0)#24 | 0.61%(+11.1)#894 |
| 25. | Bromide | 11.6% | 0.66%(+11.0)#25 | 0.61%(+11.0)#896 |
| 26. | Arnett | 11.6% | 0.66%(+10.9)#26 | 0.61%(+11.0)#900 |
| 27. | Valley Park | 11.1% | 0.66%(+10.4)#27 | 0.61%(+10.5)#943 |
| 28. | Texhoma | 10.7% | 0.66%(+10.0)#28 | 0.61%(+10.1)#998 |
| 29. | Carlisle | 10.0% | 0.66%(+9.34)#29 | 0.61%(+9.39)#1,065 |
| 30. | Centrahoma | 10.0% | 0.66%(+9.34)#30 | 0.61%(+9.39)#1,072 |
| 31. | Keefton | 9.9% | 0.66%(+9.27)#31 | 0.61%(+9.33)#1,084 |
| 32. | Mill Creek | 9.9% | 0.66%(+9.24)#32 | 0.61%(+9.30)#1,090 |
| 33. | Goltry | 9.9% | 0.66%(+9.20)#33 | 0.61%(+9.26)#1,096 |
| 34. | Hunter | 9.6% | 0.66%(+8.95)#34 | 0.61%(+9.01)#1,130 |
| 35. | Hammon | 9.6% | 0.66%(+8.89)#35 | 0.61%(+8.95)#1,136 |
| 36. | Leon | 9.5% | 0.66%(+8.86)#36 | 0.61%(+8.92)#1,147 |
| 37. | Bluejacket | 9.3% | 0.66%(+8.68)#37 | 0.61%(+8.74)#1,176 |
| 38. | Greenfield | 9.1% | 0.66%(+8.43)#38 | 0.61%(+8.49)#1,213 |
| 39. | Cherry Tree | 8.7% | 0.66%(+8.03)#39 | 0.61%(+8.09)#1,279 |
| 40. | Shady Grove Cdp Cherokee County | 8.6% | 0.66%(+7.95)#40 | 0.61%(+8.01)#1,297 |
| 41. | Burlington | 8.6% | 0.66%(+7.91)#41 | 0.61%(+7.97)#1,308 |
| 42. | Cottonwood | 7.9% | 0.66%(+7.23)#42 | 0.61%(+7.29)#1,458 |
| 43. | North Miami | 7.8% | 0.66%(+7.18)#43 | 0.61%(+7.24)#1,467 |
| 44. | Hollis | 7.5% | 0.66%(+6.84)#44 | 0.61%(+6.90)#1,543 |
| 45. | Faxon | 7.4% | 0.66%(+6.74)#45 | 0.61%(+6.80)#1,573 |
| 46. | Canton | 7.3% | 0.66%(+6.67)#46 | 0.61%(+6.73)#1,588 |
| 47. | Lane | 7.3% | 0.66%(+6.61)#47 | 0.61%(+6.67)#1,601 |
| 48. | Eldon | 7.2% | 0.66%(+6.58)#48 | 0.61%(+6.64)#1,606 |
| 49. | Reydon | 6.8% | 0.66%(+6.09)#49 | 0.61%(+6.15)#1,720 |
| 50. | Little Ponderosa | 6.7% | 0.66%(+6.04)#50 | 0.61%(+6.10)#1,728 |
| 51. | East Duke | 6.7% | 0.66%(+6.00)#51 | 0.61%(+6.06)#1,740 |
| 52. | Horntown | 6.7% | 0.66%(+6.00)#52 | 0.61%(+6.06)#1,747 |
| 53. | Tishomingo | 6.5% | 0.66%(+5.80)#53 | 0.61%(+5.86)#1,792 |
| 54. | Bradley | 6.5% | 0.66%(+5.79)#54 | 0.61%(+5.85)#1,797 |
| 55. | Garber | 6.4% | 0.66%(+5.78)#55 | 0.61%(+5.84)#1,798 |
| 56. | Twin Oaks | 6.4% | 0.66%(+5.76)#56 | 0.61%(+5.82)#1,801 |
| 57. | Caney | 6.3% | 0.66%(+5.66)#57 | 0.61%(+5.72)#1,828 |
| 58. | Davidson | 6.1% | 0.66%(+5.40)#58 | 0.61%(+5.46)#1,907 |
| 59. | Lamar | 6.1% | 0.66%(+5.40)#59 | 0.61%(+5.46)#1,908 |
| 60. | Optima | 5.9% | 0.66%(+5.27)#60 | 0.61%(+5.33)#1,947 |
| 61. | Dry Creek | 5.9% | 0.66%(+5.22)#61 | 0.61%(+5.28)#1,961 |
| 62. | Hooker | 5.9% | 0.66%(+5.21)#62 | 0.61%(+5.27)#1,974 |
| 63. | Buffalo | 5.7% | 0.66%(+5.04)#63 | 0.61%(+5.10)#2,019 |
| 64. | Alva | 5.7% | 0.66%(+5.04)#64 | 0.61%(+5.10)#2,021 |
| 65. | Peoria | 5.6% | 0.66%(+4.89)#65 | 0.61%(+4.95)#2,075 |
| 66. | Grainola | 5.6% | 0.66%(+4.89)#66 | 0.61%(+4.95)#2,077 |
| 67. | Erick | 5.4% | 0.66%(+4.75)#67 | 0.61%(+4.81)#2,139 |
| 68. | Indianola | 5.4% | 0.66%(+4.74)#68 | 0.61%(+4.80)#2,148 |
| 69. | Chattanooga | 5.4% | 0.66%(+4.72)#69 | 0.61%(+4.78)#2,156 |
| 70. | Adams | 5.3% | 0.66%(+4.65)#70 | 0.61%(+4.71)#2,178 |
| 71. | Laverne | 5.3% | 0.66%(+4.63)#71 | 0.61%(+4.69)#2,187 |
| 72. | Slick | 5.3% | 0.66%(+4.60)#72 | 0.61%(+4.66)#2,201 |
| 73. | Mountain View | 5.2% | 0.66%(+4.53)#73 | 0.61%(+4.58)#2,226 |
| 74. | Pond Creek | 5.2% | 0.66%(+4.51)#74 | 0.61%(+4.57)#2,231 |
| 75. | Brent | 5.1% | 0.66%(+4.48)#75 | 0.61%(+4.54)#2,245 |
| 76. | Toppers | 5.1% | 0.66%(+4.48)#76 | 0.61%(+4.54)#2,249 |
| 77. | Lequire | 5.0% | 0.66%(+4.34)#77 | 0.61%(+4.39)#2,308 |
| 78. | Kendrick | 5.0% | 0.66%(+4.34)#78 | 0.61%(+4.39)#2,310 |
| 79. | Checotah | 4.9% | 0.66%(+4.19)#79 | 0.61%(+4.25)#2,370 |
| 80. | Goodwell | 4.8% | 0.66%(+4.10)#80 | 0.61%(+4.16)#2,410 |
| 81. | Addington | 4.8% | 0.66%(+4.10)#81 | 0.61%(+4.16)#2,417 |
| 82. | Albion | 4.8% | 0.66%(+4.10)#82 | 0.61%(+4.16)#2,419 |
| 83. | Strong City | 4.8% | 0.66%(+4.10)#83 | 0.61%(+4.16)#2,420 |
| 84. | Billings | 4.7% | 0.66%(+4.07)#84 | 0.61%(+4.13)#2,430 |
| 85. | Terral | 4.7% | 0.66%(+4.06)#85 | 0.61%(+4.12)#2,433 |
| 86. | Jet | 4.7% | 0.66%(+4.05)#86 | 0.61%(+4.11)#2,436 |
| 87. | Boise City | 4.7% | 0.66%(+4.03)#87 | 0.61%(+4.09)#2,447 |
| 88. | Boswell | 4.7% | 0.66%(+3.99)#88 | 0.61%(+4.05)#2,462 |
| 89. | Spavinaw | 4.7% | 0.66%(+3.99)#89 | 0.61%(+4.05)#2,463 |
| 90. | Foss | 4.7% | 0.66%(+3.99)#90 | 0.61%(+4.05)#2,469 |
| 91. | Kansas | 4.6% | 0.66%(+3.92)#91 | 0.61%(+3.98)#2,495 |
| 92. | Temple | 4.6% | 0.66%(+3.91)#92 | 0.61%(+3.97)#2,500 |
| 93. | Marshall | 4.5% | 0.66%(+3.79)#93 | 0.61%(+3.85)#2,566 |
| 94. | Pensacola | 4.3% | 0.66%(+3.68)#94 | 0.61%(+3.74)#2,624 |
| 95. | Welty | 4.3% | 0.66%(+3.59)#95 | 0.61%(+3.65)#2,671 |
| 96. | Brushy | 4.2% | 0.66%(+3.56)#96 | 0.61%(+3.62)#2,692 |
| 97. | Fitzhugh | 4.2% | 0.66%(+3.50)#97 | 0.61%(+3.56)#2,722 |
| 98. | Keota | 4.1% | 0.66%(+3.48)#98 | 0.61%(+3.54)#2,740 |
| 99. | Canute | 3.9% | 0.66%(+3.21)#99 | 0.61%(+3.27)#2,910 |
| 100. | Carmen | 3.9% | 0.66%(+3.21)#100 | 0.61%(+3.27)#2,915 |
Common Questions
What are the Top 10 Cities with the Highest Percentage of Population Employed in Farming, Fishing & Forestry in Oklahoma?
Top 10 Cities with the Highest Percentage of Population Employed in Farming, Fishing & Forestry in Oklahoma are:
What city has the Highest Percentage of Population Employed in Farming, Fishing & Forestry in Oklahoma?
Knowles has the Highest Percentage of Population Employed in Farming, Fishing & Forestry in Oklahoma with 75.0%.
What is the Percentage of Population Employed in Farming, Fishing & Forestry in the State of Oklahoma?
Percentage of Population Employed in Farming, Fishing & Forestry in Oklahoma is 0.66%.
What is the Percentage of Population Employed in Farming, Fishing & Forestry in the United States?
Percentage of Population Employed in Farming, Fishing & Forestry in the United States is 0.61%.