Cities with the Highest Percentage of Population Employed in Farming, Fishing & Forestry in Tennessee
RELATED REPORTS & OPTIONS
Farming, Fishing & Forestry
Tennessee
Compare Cities
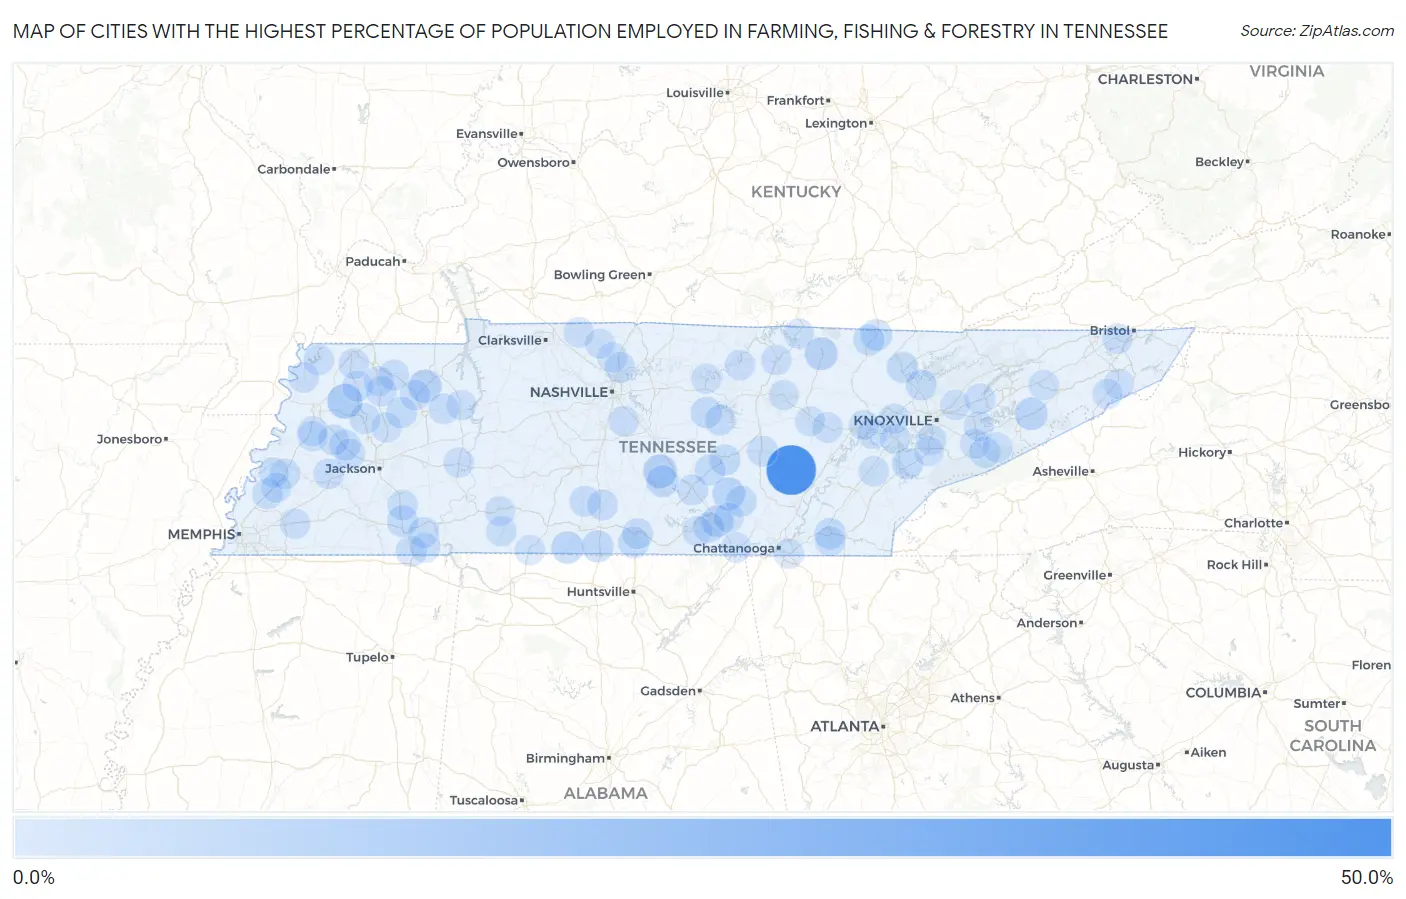
Map of Cities with the Highest Percentage of Population Employed in Farming, Fishing & Forestry in Tennessee
0.0%
50.0%
Cities with the Highest Percentage of Population Employed in Farming, Fishing & Forestry in Tennessee
| City | % Employed | vs State | vs National | |
| 1. | Pikeville | 41.8% | 0.36%(+41.5)#1 | 0.61%(+41.2)#115 |
| 2. | Rocky Top | 14.4% | 0.36%(+14.0)#2 | 0.61%(+13.8)#676 |
| 3. | Yorkville | 10.4% | 0.36%(+10.0)#3 | 0.61%(+9.76)#1,025 |
| 4. | Morris Chapel | 8.4% | 0.36%(+8.06)#4 | 0.61%(+7.82)#1,337 |
| 5. | Bell Buckle | 7.6% | 0.36%(+7.21)#5 | 0.61%(+6.97)#1,530 |
| 6. | Henry | 6.7% | 0.36%(+6.36)#6 | 0.61%(+6.11)#1,724 |
| 7. | Jamestown | 5.9% | 0.36%(+5.58)#7 | 0.61%(+5.33)#1,944 |
| 8. | Hilham | 5.6% | 0.36%(+5.27)#8 | 0.61%(+5.02)#2,047 |
| 9. | Parrottsville | 5.5% | 0.36%(+5.12)#9 | 0.61%(+4.87)#2,105 |
| 10. | Altamont | 5.2% | 0.36%(+4.81)#10 | 0.61%(+4.56)#2,237 |
| 11. | Minor Hill | 4.7% | 0.36%(+4.34)#11 | 0.61%(+4.09)#2,444 |
| 12. | Monteagle | 4.3% | 0.36%(+3.92)#12 | 0.61%(+3.67)#2,660 |
| 13. | Elkton | 3.7% | 0.36%(+3.35)#13 | 0.61%(+3.10)#3,031 |
| 14. | Wartrace | 3.6% | 0.36%(+3.27)#14 | 0.61%(+3.02)#3,100 |
| 15. | East Cleveland | 3.3% | 0.36%(+2.91)#15 | 0.61%(+2.66)#3,402 |
| 16. | Winfield | 3.0% | 0.36%(+2.67)#16 | 0.61%(+2.42)#3,620 |
| 17. | Bethel Springs | 2.9% | 0.36%(+2.53)#17 | 0.61%(+2.28)#3,752 |
| 18. | Caryville | 2.8% | 0.36%(+2.44)#18 | 0.61%(+2.19)#3,845 |
| 19. | Dowelltown | 2.8% | 0.36%(+2.42)#19 | 0.61%(+2.17)#3,867 |
| 20. | Trezevant | 2.7% | 0.36%(+2.34)#20 | 0.61%(+2.09)#3,969 |
| 21. | Oneida | 2.5% | 0.36%(+2.16)#21 | 0.61%(+1.91)#4,192 |
| 22. | Greenback | 2.4% | 0.36%(+2.00)#22 | 0.61%(+1.76)#4,368 |
| 23. | Fowlkes | 2.3% | 0.36%(+1.96)#23 | 0.61%(+1.71)#4,430 |
| 24. | Park City | 2.3% | 0.36%(+1.95)#24 | 0.61%(+1.70)#4,439 |
| 25. | Mcminnville | 2.2% | 0.36%(+1.88)#25 | 0.61%(+1.63)#4,524 |
| 26. | Norris | 2.2% | 0.36%(+1.82)#26 | 0.61%(+1.57)#4,601 |
| 27. | Gruetli Laager | 2.1% | 0.36%(+1.76)#27 | 0.61%(+1.52)#4,693 |
| 28. | Morrison | 2.1% | 0.36%(+1.76)#28 | 0.61%(+1.51)#4,695 |
| 29. | Manchester | 2.0% | 0.36%(+1.69)#29 | 0.61%(+1.44)#4,794 |
| 30. | Lynnville | 2.0% | 0.36%(+1.64)#30 | 0.61%(+1.39)#4,874 |
| 31. | Stantonville | 2.0% | 0.36%(+1.63)#31 | 0.61%(+1.38)#4,895 |
| 32. | Fayetteville | 2.0% | 0.36%(+1.62)#32 | 0.61%(+1.38)#4,901 |
| 33. | Cornersville | 1.9% | 0.36%(+1.57)#33 | 0.61%(+1.33)#4,980 |
| 34. | Smithville | 1.9% | 0.36%(+1.57)#34 | 0.61%(+1.32)#4,988 |
| 35. | Guys | 1.8% | 0.36%(+1.47)#35 | 0.61%(+1.22)#5,143 |
| 36. | Gatlinburg | 1.8% | 0.36%(+1.43)#36 | 0.61%(+1.19)#5,199 |
| 37. | Sewanee | 1.7% | 0.36%(+1.31)#37 | 0.61%(+1.06)#5,412 |
| 38. | Alamo | 1.7% | 0.36%(+1.31)#38 | 0.61%(+1.06)#5,429 |
| 39. | Maury City | 1.6% | 0.36%(+1.26)#39 | 0.61%(+1.01)#5,520 |
| 40. | Goodlettsville | 1.6% | 0.36%(+1.24)#40 | 0.61%(+0.989)#5,585 |
| 41. | Trenton | 1.6% | 0.36%(+1.23)#41 | 0.61%(+0.985)#5,590 |
| 42. | Spencer | 1.5% | 0.36%(+1.14)#42 | 0.61%(+0.895)#5,753 |
| 43. | Dresden | 1.5% | 0.36%(+1.13)#43 | 0.61%(+0.886)#5,781 |
| 44. | Atoka | 1.4% | 0.36%(+1.04)#44 | 0.61%(+0.790)#5,984 |
| 45. | Covington | 1.4% | 0.36%(+1.03)#45 | 0.61%(+0.787)#5,990 |
| 46. | New Market | 1.4% | 0.36%(+1.03)#46 | 0.61%(+0.786)#5,992 |
| 47. | Crab Orchard | 1.4% | 0.36%(+1.02)#47 | 0.61%(+0.776)#6,011 |
| 48. | Livingston | 1.4% | 0.36%(+1.02)#48 | 0.61%(+0.770)#6,021 |
| 49. | Brownsville | 1.3% | 0.36%(+0.973)#49 | 0.61%(+0.725)#6,135 |
| 50. | Finger | 1.3% | 0.36%(+0.967)#50 | 0.61%(+0.719)#6,153 |
| 51. | Blountville | 1.2% | 0.36%(+0.886)#51 | 0.61%(+0.639)#6,361 |
| 52. | Kenton | 1.2% | 0.36%(+0.879)#52 | 0.61%(+0.632)#6,376 |
| 53. | Samburg | 1.2% | 0.36%(+0.833)#53 | 0.61%(+0.585)#6,500 |
| 54. | Ridgely | 1.2% | 0.36%(+0.830)#54 | 0.61%(+0.583)#6,502 |
| 55. | Gainesboro | 1.2% | 0.36%(+0.822)#55 | 0.61%(+0.574)#6,522 |
| 56. | Rives | 1.2% | 0.36%(+0.819)#56 | 0.61%(+0.571)#6,538 |
| 57. | Bruceton | 1.1% | 0.36%(+0.781)#57 | 0.61%(+0.533)#6,619 |
| 58. | Bells | 1.1% | 0.36%(+0.761)#58 | 0.61%(+0.514)#6,684 |
| 59. | Nolensville | 0.95% | 0.36%(+0.596)#59 | 0.61%(+0.348)#7,168 |
| 60. | Greenfield | 0.95% | 0.36%(+0.590)#60 | 0.61%(+0.342)#7,192 |
| 61. | Oakland | 0.91% | 0.36%(+0.552)#61 | 0.61%(+0.305)#7,302 |
| 62. | Gates | 0.90% | 0.36%(+0.539)#62 | 0.61%(+0.291)#7,359 |
| 63. | Collinwood | 0.89% | 0.36%(+0.534)#63 | 0.61%(+0.286)#7,376 |
| 64. | Oak Ridge | 0.89% | 0.36%(+0.528)#64 | 0.61%(+0.280)#7,397 |
| 65. | Sweetwater | 0.84% | 0.36%(+0.482)#65 | 0.61%(+0.234)#7,568 |
| 66. | Adams | 0.80% | 0.36%(+0.447)#66 | 0.61%(+0.199)#7,694 |
| 67. | Byrdstown | 0.80% | 0.36%(+0.442)#67 | 0.61%(+0.194)#7,708 |
| 68. | Alcoa | 0.79% | 0.36%(+0.430)#68 | 0.61%(+0.183)#7,754 |
| 69. | Mckenzie | 0.77% | 0.36%(+0.412)#69 | 0.61%(+0.164)#7,819 |
| 70. | Kingston | 0.74% | 0.36%(+0.384)#70 | 0.61%(+0.136)#7,934 |
| 71. | Parsons | 0.72% | 0.36%(+0.364)#71 | 0.61%(+0.116)#8,008 |
| 72. | Sharon | 0.67% | 0.36%(+0.312)#72 | 0.61%(+0.064)#8,207 |
| 73. | Milan | 0.67% | 0.36%(+0.310)#73 | 0.61%(+0.063)#8,218 |
| 74. | Garland | 0.66% | 0.36%(+0.305)#74 | 0.61%(+0.057)#8,245 |
| 75. | Brighton | 0.65% | 0.36%(+0.297)#75 | 0.61%(+0.049)#8,275 |
| 76. | Halls | 0.64% | 0.36%(+0.286)#76 | 0.61%(+0.038)#8,315 |
| 77. | Carthage | 0.64% | 0.36%(+0.285)#77 | 0.61%(+0.038)#8,317 |
| 78. | Lenoir City | 0.62% | 0.36%(+0.262)#78 | 0.61%(+0.015)#8,406 |
| 79. | Mascot | 0.61% | 0.36%(+0.257)#79 | 0.61%(+0.009)#8,429 |
| 80. | Pigeon Forge | 0.59% | 0.36%(+0.237)#80 | 0.61%(-0.011)#8,532 |
| 81. | Ridgetop | 0.59% | 0.36%(+0.234)#81 | 0.61%(-0.014)#8,541 |
| 82. | St Joseph | 0.57% | 0.36%(+0.212)#82 | 0.61%(-0.036)#8,636 |
| 83. | Kimball | 0.55% | 0.36%(+0.197)#83 | 0.61%(-0.051)#8,708 |
| 84. | Crossville | 0.55% | 0.36%(+0.189)#84 | 0.61%(-0.059)#8,747 |
| 85. | Tracy City | 0.54% | 0.36%(+0.187)#85 | 0.61%(-0.061)#8,758 |
| 86. | Mosheim | 0.54% | 0.36%(+0.183)#86 | 0.61%(-0.064)#8,778 |
| 87. | Waynesboro | 0.54% | 0.36%(+0.183)#87 | 0.61%(-0.065)#8,785 |
| 88. | Wildwood Lake | 0.51% | 0.36%(+0.156)#88 | 0.61%(-0.092)#8,905 |
| 89. | Springfield | 0.51% | 0.36%(+0.149)#89 | 0.61%(-0.099)#8,942 |
| 90. | Cowan | 0.50% | 0.36%(+0.141)#90 | 0.61%(-0.106)#8,981 |
| 91. | Unicoi | 0.50% | 0.36%(+0.140)#91 | 0.61%(-0.108)#8,990 |
| 92. | Harriman | 0.49% | 0.36%(+0.134)#92 | 0.61%(-0.114)#9,016 |
| 93. | Monterey | 0.46% | 0.36%(+0.105)#93 | 0.61%(-0.143)#9,189 |
| 94. | East Ridge | 0.45% | 0.36%(+0.097)#94 | 0.61%(-0.151)#9,234 |
| 95. | Michie | 0.45% | 0.36%(+0.097)#95 | 0.61%(-0.151)#9,239 |
| 96. | Maryville | 0.39% | 0.36%(+0.034)#96 | 0.61%(-0.213)#9,593 |
| 97. | Erwin | 0.39% | 0.36%(+0.028)#97 | 0.61%(-0.219)#9,632 |
| 98. | Sevierville | 0.38% | 0.36%(+0.019)#98 | 0.61%(-0.229)#9,686 |
| 99. | Pittman Center | 0.37% | 0.36%(+0.014)#99 | 0.61%(-0.234)#9,724 |
| 100. | Camden | 0.36% | 0.36%(+0.002)#100 | 0.61%(-0.246)#9,788 |
Common Questions
What are the Top 10 Cities with the Highest Percentage of Population Employed in Farming, Fishing & Forestry in Tennessee?
Top 10 Cities with the Highest Percentage of Population Employed in Farming, Fishing & Forestry in Tennessee are:
#1
41.8%
#2
10.4%
#3
7.6%
#4
6.7%
#5
5.9%
#6
5.5%
#7
5.2%
#8
4.7%
#9
4.3%
#10
3.7%
What city has the Highest Percentage of Population Employed in Farming, Fishing & Forestry in Tennessee?
Pikeville has the Highest Percentage of Population Employed in Farming, Fishing & Forestry in Tennessee with 41.8%.
What is the Percentage of Population Employed in Farming, Fishing & Forestry in the State of Tennessee?
Percentage of Population Employed in Farming, Fishing & Forestry in Tennessee is 0.36%.
What is the Percentage of Population Employed in Farming, Fishing & Forestry in the United States?
Percentage of Population Employed in Farming, Fishing & Forestry in the United States is 0.61%.