Cities with the Highest Percentage of Population Employed in Farming, Fishing & Forestry in New Mexico
RELATED REPORTS & OPTIONS
Farming, Fishing & Forestry
New Mexico
Compare Cities
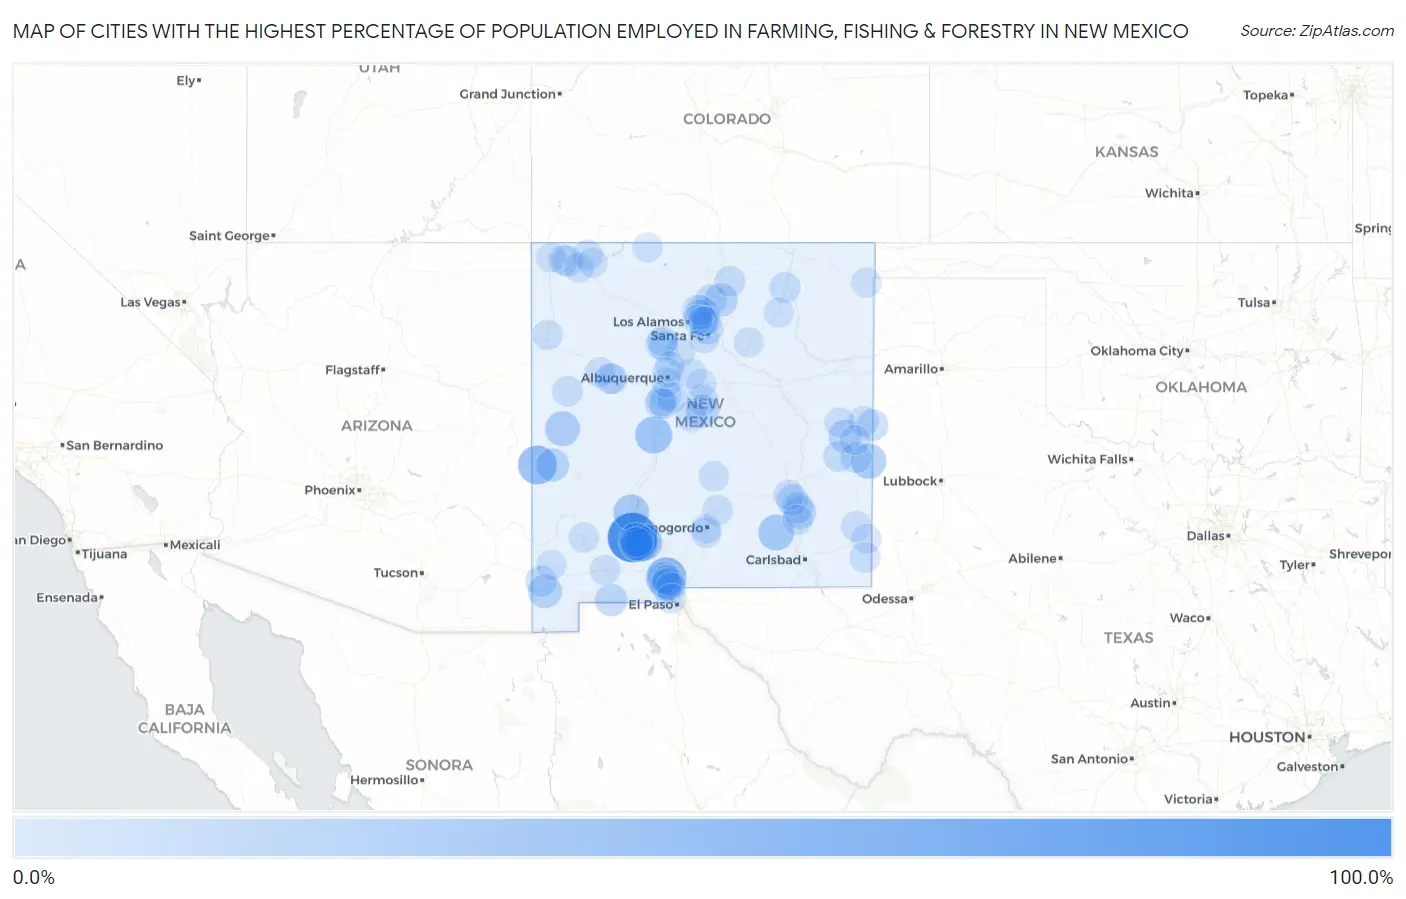
Map of Cities with the Highest Percentage of Population Employed in Farming, Fishing & Forestry in New Mexico
0.0%
100.0%
Cities with the Highest Percentage of Population Employed in Farming, Fishing & Forestry in New Mexico
| City | % Employed | vs State | vs National | |
| 1. | Garfield | 100.0% | 0.91%(+99.1)#1 | 0.61%(+99.4)#4 |
| 2. | Las Tusas | 75.0% | 0.91%(+74.1)#2 | 0.61%(+74.4)#29 |
| 3. | Mesquite | 51.1% | 0.91%(+50.1)#3 | 0.61%(+50.4)#73 |
| 4. | Placitas Cdp Dona Ana County | 48.8% | 0.91%(+47.9)#4 | 0.61%(+48.2)#87 |
| 5. | Luna | 44.4% | 0.91%(+43.5)#5 | 0.61%(+43.8)#100 |
| 6. | San Acacia | 34.3% | 0.91%(+33.4)#6 | 0.61%(+33.7)#169 |
| 7. | Rincon | 33.0% | 0.91%(+32.1)#7 | 0.61%(+32.4)#180 |
| 8. | Rodey | 30.0% | 0.91%(+29.1)#8 | 0.61%(+29.4)#221 |
| 9. | Williamsburg | 28.9% | 0.91%(+27.9)#9 | 0.61%(+28.2)#241 |
| 10. | Hope | 28.6% | 0.91%(+27.7)#10 | 0.61%(+28.0)#244 |
| 11. | Causey | 25.4% | 0.91%(+24.5)#11 | 0.61%(+24.8)#316 |
| 12. | Quemado | 24.1% | 0.91%(+23.2)#12 | 0.61%(+23.5)#338 |
| 13. | Broadview | 20.6% | 0.91%(+19.6)#13 | 0.61%(+20.0)#422 |
| 14. | Salem | 19.8% | 0.91%(+18.9)#14 | 0.61%(+19.2)#452 |
| 15. | Animas | 18.0% | 0.91%(+17.1)#15 | 0.61%(+17.4)#514 |
| 16. | Picuris Pueblo | 16.1% | 0.91%(+15.2)#16 | 0.61%(+15.5)#588 |
| 17. | Cruzville | 15.9% | 0.91%(+15.0)#17 | 0.61%(+15.3)#597 |
| 18. | Hatch | 15.3% | 0.91%(+14.4)#18 | 0.61%(+14.7)#630 |
| 19. | Willard | 14.4% | 0.91%(+13.5)#19 | 0.61%(+13.8)#674 |
| 20. | Floyd | 14.3% | 0.91%(+13.4)#20 | 0.61%(+13.7)#689 |
| 21. | Berino | 12.4% | 0.91%(+11.5)#21 | 0.61%(+11.8)#839 |
| 22. | Hagerman | 12.1% | 0.91%(+11.2)#22 | 0.61%(+11.5)#855 |
| 23. | Columbus | 11.7% | 0.91%(+10.8)#23 | 0.61%(+11.1)#888 |
| 24. | Chamberino | 10.3% | 0.91%(+9.36)#24 | 0.61%(+9.66)#1,038 |
| 25. | Dexter | 9.2% | 0.91%(+8.25)#25 | 0.61%(+8.55)#1,199 |
| 26. | San Miguel | 8.8% | 0.91%(+7.90)#26 | 0.61%(+8.20)#1,268 |
| 27. | Texico | 8.5% | 0.91%(+7.60)#27 | 0.61%(+7.90)#1,320 |
| 28. | Lybrook | 8.2% | 0.91%(+7.25)#28 | 0.61%(+7.55)#1,394 |
| 29. | Dixon | 7.8% | 0.91%(+6.94)#29 | 0.61%(+7.24)#1,466 |
| 30. | San Ysidro | 7.7% | 0.91%(+6.79)#30 | 0.61%(+7.09)#1,494 |
| 31. | White Cliffs | 7.6% | 0.91%(+6.72)#31 | 0.61%(+7.02)#1,521 |
| 32. | Midway | 7.1% | 0.91%(+6.16)#32 | 0.61%(+6.46)#1,648 |
| 33. | Cotton City | 7.0% | 0.91%(+6.08)#33 | 0.61%(+6.38)#1,669 |
| 34. | Peak Place | 6.5% | 0.91%(+5.63)#34 | 0.61%(+5.93)#1,774 |
| 35. | Estancia | 6.5% | 0.91%(+5.62)#35 | 0.61%(+5.92)#1,778 |
| 36. | Springer | 6.1% | 0.91%(+5.15)#36 | 0.61%(+5.45)#1,911 |
| 37. | Dora | 5.7% | 0.91%(+4.81)#37 | 0.61%(+5.11)#2,018 |
| 38. | Peralta | 5.5% | 0.91%(+4.61)#38 | 0.61%(+4.91)#2,092 |
| 39. | Ojo Encino | 5.5% | 0.91%(+4.55)#39 | 0.61%(+4.85)#2,120 |
| 40. | Elida | 4.8% | 0.91%(+3.86)#40 | 0.61%(+4.16)#2,414 |
| 41. | Mountainair | 4.7% | 0.91%(+3.84)#41 | 0.61%(+4.14)#2,424 |
| 42. | Belen | 4.7% | 0.91%(+3.76)#42 | 0.61%(+4.06)#2,455 |
| 43. | Taos Pueblo | 4.7% | 0.91%(+3.76)#43 | 0.61%(+4.06)#2,458 |
| 44. | La Puebla | 4.3% | 0.91%(+3.43)#44 | 0.61%(+3.73)#2,631 |
| 45. | Vado | 4.3% | 0.91%(+3.35)#45 | 0.61%(+3.65)#2,673 |
| 46. | Mccartys Village | 4.2% | 0.91%(+3.32)#46 | 0.61%(+3.62)#2,690 |
| 47. | Hernandez | 4.2% | 0.91%(+3.31)#47 | 0.61%(+3.61)#2,697 |
| 48. | Nenahnezad | 3.7% | 0.91%(+2.84)#48 | 0.61%(+3.14)#2,997 |
| 49. | Agua Fria | 3.7% | 0.91%(+2.76)#49 | 0.61%(+3.06)#3,066 |
| 50. | Waterflow | 3.6% | 0.91%(+2.73)#50 | 0.61%(+3.03)#3,086 |
| 51. | Clovis | 3.4% | 0.91%(+2.52)#51 | 0.61%(+2.82)#3,272 |
| 52. | Eunice | 3.3% | 0.91%(+2.35)#52 | 0.61%(+2.65)#3,407 |
| 53. | Pinehill | 3.3% | 0.91%(+2.35)#53 | 0.61%(+2.65)#3,409 |
| 54. | San Antonito Cdp Bernalillo County | 2.9% | 0.91%(+2.02)#54 | 0.61%(+2.32)#3,717 |
| 55. | Melrose | 2.7% | 0.91%(+1.83)#55 | 0.61%(+2.13)#3,912 |
| 56. | Roswell | 2.7% | 0.91%(+1.81)#56 | 0.61%(+2.11)#3,941 |
| 57. | Mescalero | 2.5% | 0.91%(+1.62)#57 | 0.61%(+1.92)#4,177 |
| 58. | Carrizozo | 2.5% | 0.91%(+1.59)#58 | 0.61%(+1.89)#4,215 |
| 59. | Meadow Lake | 2.5% | 0.91%(+1.57)#59 | 0.61%(+1.87)#4,239 |
| 60. | Acomita Lake | 2.4% | 0.91%(+1.51)#60 | 0.61%(+1.81)#4,299 |
| 61. | South River | 2.3% | 0.91%(+1.44)#61 | 0.61%(+1.74)#4,396 |
| 62. | Bayard | 2.3% | 0.91%(+1.43)#62 | 0.61%(+1.73)#4,403 |
| 63. | Lovington | 2.3% | 0.91%(+1.35)#63 | 0.61%(+1.65)#4,487 |
| 64. | Boles Acres | 2.1% | 0.91%(+1.19)#64 | 0.61%(+1.49)#4,715 |
| 65. | Spencerville | 2.1% | 0.91%(+1.16)#65 | 0.61%(+1.46)#4,760 |
| 66. | Deming | 1.9% | 0.91%(+0.981)#66 | 0.61%(+1.28)#5,046 |
| 67. | Grants | 1.9% | 0.91%(+0.972)#67 | 0.61%(+1.27)#5,071 |
| 68. | Napi Headquarters | 1.8% | 0.91%(+0.912)#68 | 0.61%(+1.21)#5,158 |
| 69. | Jacona | 1.8% | 0.91%(+0.849)#69 | 0.61%(+1.15)#5,265 |
| 70. | Twin Lakes | 1.7% | 0.91%(+0.761)#70 | 0.61%(+1.06)#5,415 |
| 71. | Portales | 1.6% | 0.91%(+0.662)#71 | 0.61%(+0.962)#5,630 |
| 72. | Lake Arthur | 1.5% | 0.91%(+0.549)#72 | 0.61%(+0.849)#5,863 |
| 73. | Edgewood | 1.4% | 0.91%(+0.473)#73 | 0.61%(+0.774)#6,016 |
| 74. | Santa Clara Pueblo | 1.4% | 0.91%(+0.455)#74 | 0.61%(+0.755)#6,058 |
| 75. | Moriarty | 1.3% | 0.91%(+0.401)#75 | 0.61%(+0.702)#6,192 |
| 76. | Lordsburg | 1.3% | 0.91%(+0.387)#76 | 0.61%(+0.688)#6,227 |
| 77. | San Felipe Pueblo | 1.3% | 0.91%(+0.382)#77 | 0.61%(+0.682)#6,243 |
| 78. | Dulce | 1.3% | 0.91%(+0.357)#78 | 0.61%(+0.657)#6,309 |
| 79. | Zia Pueblo | 1.3% | 0.91%(+0.354)#79 | 0.61%(+0.654)#6,322 |
| 80. | Clayton | 1.2% | 0.91%(+0.340)#80 | 0.61%(+0.640)#6,357 |
| 81. | Center Point | 1.2% | 0.91%(+0.330)#81 | 0.61%(+0.630)#6,381 |
| 82. | Wagon Mound | 1.2% | 0.91%(+0.299)#82 | 0.61%(+0.599)#6,459 |
| 83. | Los Chaves | 1.1% | 0.91%(+0.232)#83 | 0.61%(+0.532)#6,622 |
| 84. | Bloomfield | 1.1% | 0.91%(+0.151)#84 | 0.61%(+0.451)#6,864 |
| 85. | Alamogordo | 1.0% | 0.91%(+0.102)#85 | 0.61%(+0.403)#7,014 |
| 86. | Hobbs | 1.00% | 0.91%(+0.092)#86 | 0.61%(+0.392)#7,037 |
| 87. | San Jose Cdp Rio Arriba County | 0.92% | 0.91%(+0.012)#87 | 0.61%(+0.312)#7,290 |
| 88. | Anthony | 0.85% | 0.91%(-0.059)#88 | 0.61%(+0.241)#7,532 |
| 89. | Shiprock | 0.83% | 0.91%(-0.077)#89 | 0.61%(+0.223)#7,600 |
| 90. | Jemez Pueblo | 0.81% | 0.91%(-0.099)#90 | 0.61%(+0.201)#7,688 |
| 91. | Ohkay Owingeh | 0.78% | 0.91%(-0.126)#91 | 0.61%(+0.174)#7,791 |
| 92. | Adelino | 0.77% | 0.91%(-0.141)#92 | 0.61%(+0.160)#7,846 |
| 93. | Nambe | 0.75% | 0.91%(-0.153)#93 | 0.61%(+0.147)#7,897 |
| 94. | South Valley | 0.73% | 0.91%(-0.171)#94 | 0.61%(+0.129)#7,960 |
| 95. | Los Ranchos De Albuquerque | 0.68% | 0.91%(-0.229)#95 | 0.61%(+0.071)#8,180 |
| 96. | Pojoaque | 0.66% | 0.91%(-0.247)#96 | 0.61%(+0.053)#8,255 |
| 97. | Corrales | 0.59% | 0.91%(-0.317)#97 | 0.61%(-0.016)#8,550 |
| 98. | Las Vegas | 0.58% | 0.91%(-0.326)#98 | 0.61%(-0.026)#8,587 |
| 99. | Sunland Park | 0.56% | 0.91%(-0.341)#99 | 0.61%(-0.041)#8,666 |
| 100. | San Ildefonso Pueblo | 0.55% | 0.91%(-0.358)#100 | 0.61%(-0.058)#8,741 |
Common Questions
What are the Top 10 Cities with the Highest Percentage of Population Employed in Farming, Fishing & Forestry in New Mexico?
Top 10 Cities with the Highest Percentage of Population Employed in Farming, Fishing & Forestry in New Mexico are:
#1
100.0%
#2
51.1%
#3
44.4%
#4
34.3%
#5
33.0%
#6
30.0%
#7
28.9%
#8
28.6%
#9
25.4%
#10
24.1%
What city has the Highest Percentage of Population Employed in Farming, Fishing & Forestry in New Mexico?
Garfield has the Highest Percentage of Population Employed in Farming, Fishing & Forestry in New Mexico with 100.0%.
What is the Percentage of Population Employed in Farming, Fishing & Forestry in the State of New Mexico?
Percentage of Population Employed in Farming, Fishing & Forestry in New Mexico is 0.91%.
What is the Percentage of Population Employed in Farming, Fishing & Forestry in the United States?
Percentage of Population Employed in Farming, Fishing & Forestry in the United States is 0.61%.