Zip Codes with the Highest Percentage of Population Employed in Farming, Fishing & Forestry in Santa Maria, CA
RELATED REPORTS & OPTIONS
Farming, Fishing & Forestry
Santa Maria
Compare Zip Codes
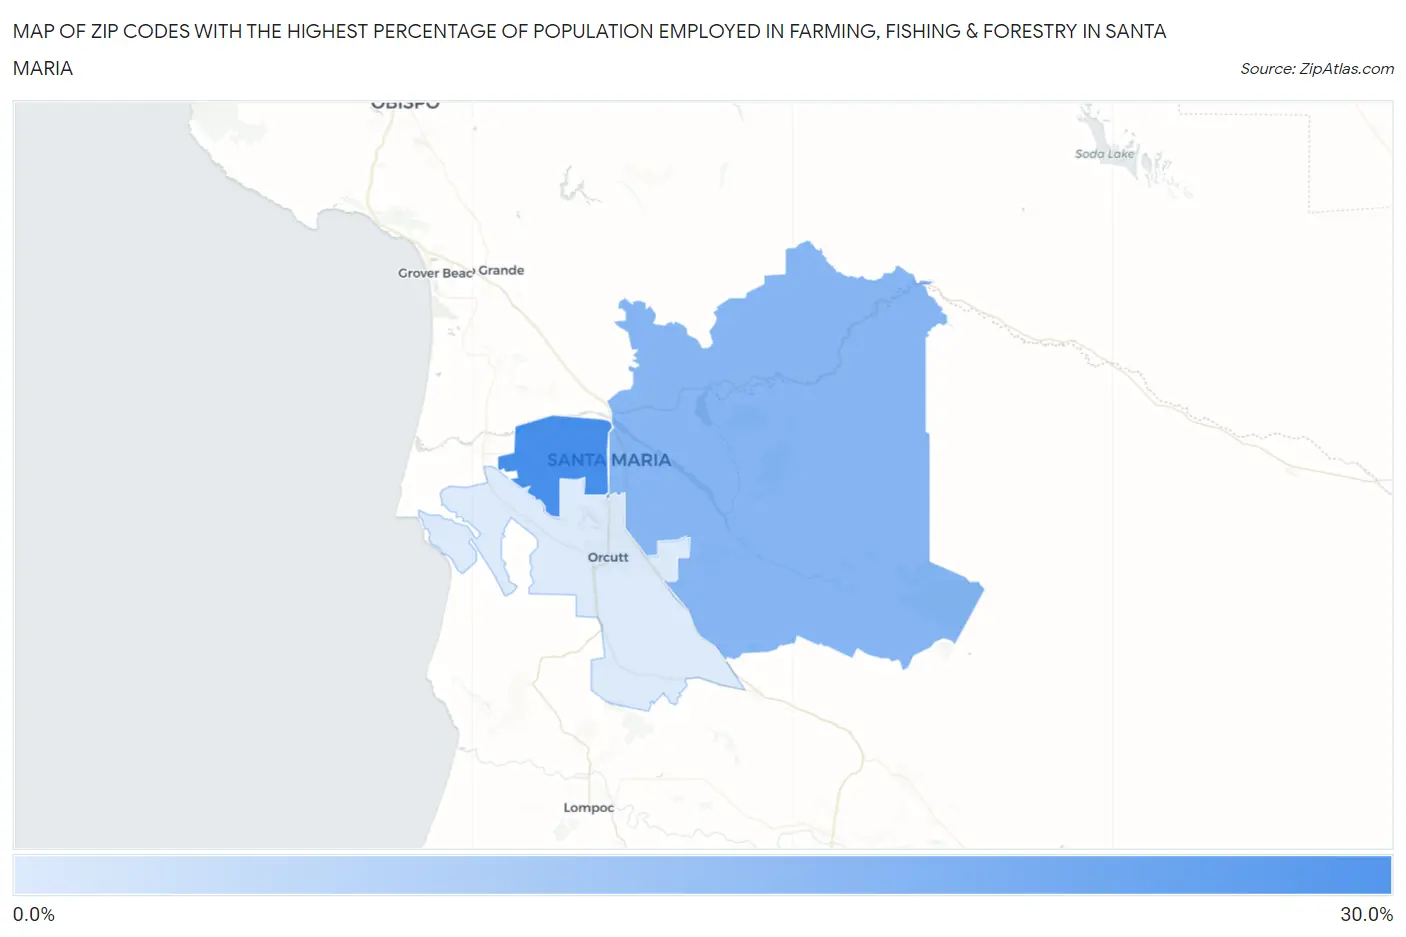
Map of Zip Codes with the Highest Percentage of Population Employed in Farming, Fishing & Forestry in Santa Maria
1.6%
26.4%
Zip Codes with the Highest Percentage of Population Employed in Farming, Fishing & Forestry in Santa Maria, CA
| Zip Code | % Employed | vs State | vs National | |
| 1. | 93458 | 26.4% | 1.4%(+25.0)#53 | 0.61%(+25.8)#257 |
| 2. | 93454 | 15.6% | 1.4%(+14.2)#103 | 0.61%(+15.0)#612 |
| 3. | 93455 | 1.6% | 1.4%(+0.167)#415 | 0.61%(+0.972)#7,657 |
1
Common Questions
What are the Top Zip Codes with the Highest Percentage of Population Employed in Farming, Fishing & Forestry in Santa Maria, CA?
Top Zip Codes with the Highest Percentage of Population Employed in Farming, Fishing & Forestry in Santa Maria, CA are:
What zip code has the Highest Percentage of Population Employed in Farming, Fishing & Forestry in Santa Maria, CA?
93458 has the Highest Percentage of Population Employed in Farming, Fishing & Forestry in Santa Maria, CA with 26.4%.
What is the Percentage of Population Employed in Farming, Fishing & Forestry in Santa Maria, CA?
Percentage of Population Employed in Farming, Fishing & Forestry in Santa Maria is 19.8%.
What is the Percentage of Population Employed in Farming, Fishing & Forestry in California?
Percentage of Population Employed in Farming, Fishing & Forestry in California is 1.4%.
What is the Percentage of Population Employed in Farming, Fishing & Forestry in the United States?
Percentage of Population Employed in Farming, Fishing & Forestry in the United States is 0.61%.