Zip Codes with the Highest Percentage of Population Employed in Farming, Fishing & Forestry in Los Angeles, CA
RELATED REPORTS & OPTIONS
Farming, Fishing & Forestry
Los Angeles
Compare Zip Codes
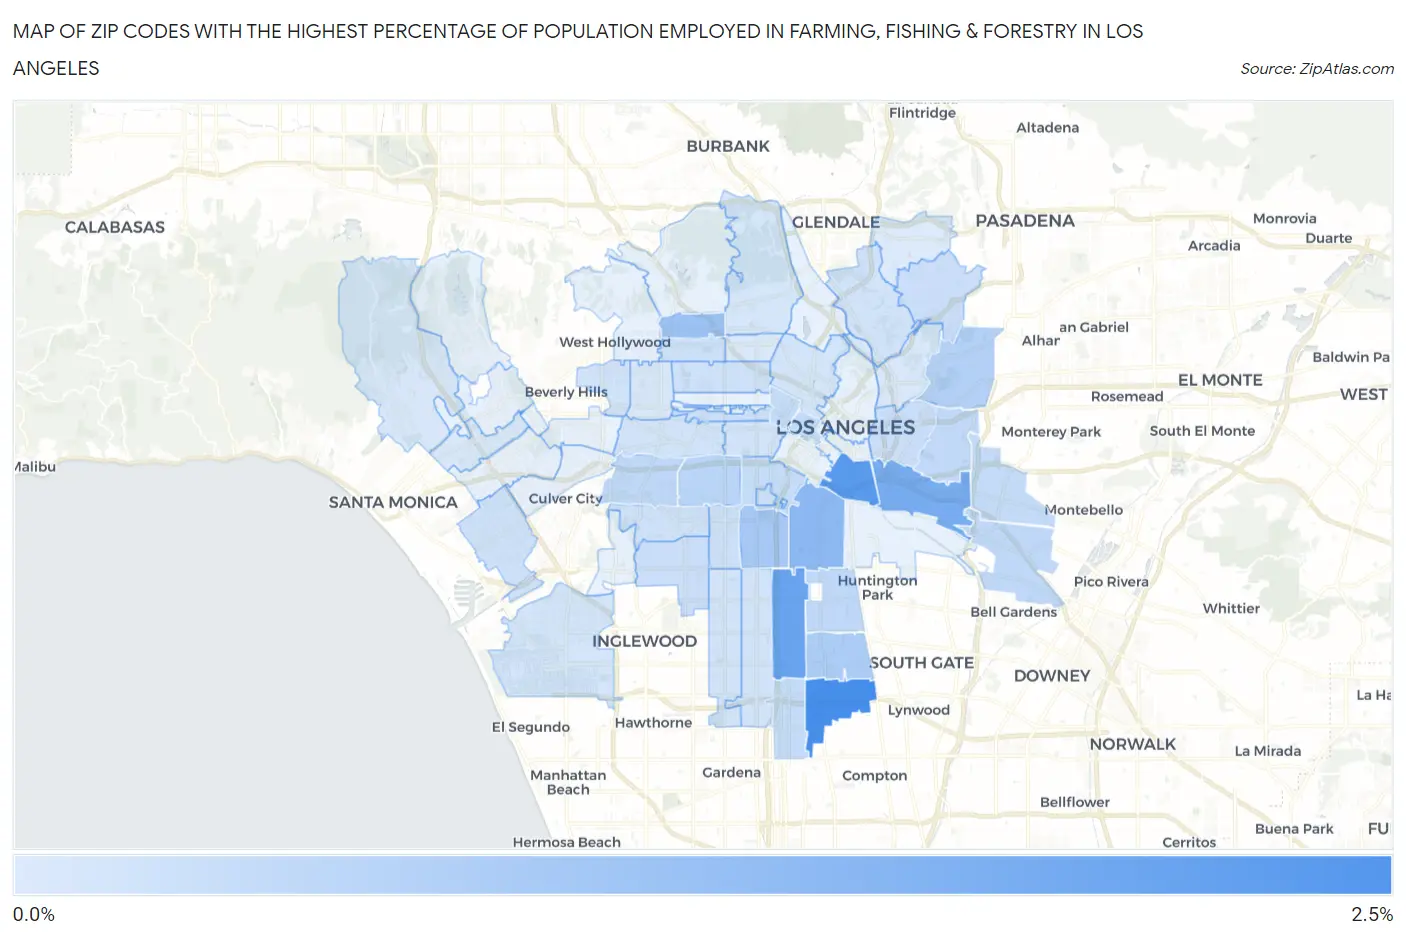
Map of Zip Codes with the Highest Percentage of Population Employed in Farming, Fishing & Forestry in Los Angeles
0.0068%
2.1%
Zip Codes with the Highest Percentage of Population Employed in Farming, Fishing & Forestry in Los Angeles, CA
| Zip Code | % Employed | vs State | vs National | |
| 1. | 90059 | 2.1% | 1.4%(+0.657)#370 | 0.61%(+1.46)#6,393 |
| 2. | 90021 | 1.8% | 1.4%(+0.436)#389 | 0.61%(+1.24)#6,901 |
| 3. | 90003 | 1.6% | 1.4%(+0.188)#412 | 0.61%(+0.993)#7,585 |
| 4. | 90023 | 1.4% | 1.4%(-0.019)#435 | 0.61%(+0.786)#8,235 |
| 5. | 90011 | 1.1% | 1.4%(-0.314)#482 | 0.61%(+0.491)#9,335 |
| 6. | 90028 | 0.92% | 1.4%(-0.493)#524 | 0.61%(+0.312)#10,140 |
| 7. | 90037 | 0.78% | 1.4%(-0.633)#569 | 0.61%(+0.172)#10,916 |
| 8. | 90002 | 0.66% | 1.4%(-0.754)#605 | 0.61%(+0.051)#11,660 |
| 9. | 90032 | 0.58% | 1.4%(-0.826)#641 | 0.61%(-0.021)#12,167 |
| 10. | 90018 | 0.49% | 1.4%(-0.918)#690 | 0.61%(-0.113)#12,914 |
| 11. | 90016 | 0.42% | 1.4%(-0.994)#742 | 0.61%(-0.189)#13,614 |
| 12. | 90001 | 0.42% | 1.4%(-0.995)#744 | 0.61%(-0.190)#13,623 |
| 13. | 90040 | 0.40% | 1.4%(-1.01)#759 | 0.61%(-0.205)#13,742 |
| 14. | 90063 | 0.38% | 1.4%(-1.03)#773 | 0.61%(-0.222)#13,910 |
| 15. | 90017 | 0.35% | 1.4%(-1.06)#798 | 0.61%(-0.256)#14,266 |
| 16. | 90061 | 0.35% | 1.4%(-1.06)#799 | 0.61%(-0.256)#14,267 |
| 17. | 90057 | 0.35% | 1.4%(-1.06)#802 | 0.61%(-0.258)#14,292 |
| 18. | 90022 | 0.34% | 1.4%(-1.07)#806 | 0.61%(-0.263)#14,340 |
| 19. | 90007 | 0.32% | 1.4%(-1.09)#833 | 0.61%(-0.289)#14,640 |
| 20. | 90005 | 0.27% | 1.4%(-1.14)#870 | 0.61%(-0.332)#15,137 |
| 21. | 90089 | 0.27% | 1.4%(-1.14)#876 | 0.61%(-0.339)#15,205 |
| 22. | 90043 | 0.26% | 1.4%(-1.15)#878 | 0.61%(-0.344)#15,262 |
| 23. | 90033 | 0.26% | 1.4%(-1.15)#881 | 0.61%(-0.347)#15,303 |
| 24. | 90042 | 0.24% | 1.4%(-1.17)#898 | 0.61%(-0.361)#15,488 |
| 25. | 90038 | 0.22% | 1.4%(-1.19)#929 | 0.61%(-0.383)#15,808 |
| 26. | 90062 | 0.22% | 1.4%(-1.19)#932 | 0.61%(-0.385)#15,830 |
| 27. | 90004 | 0.21% | 1.4%(-1.20)#938 | 0.61%(-0.399)#16,038 |
| 28. | 90008 | 0.20% | 1.4%(-1.21)#948 | 0.61%(-0.407)#16,154 |
| 29. | 90066 | 0.19% | 1.4%(-1.22)#952 | 0.61%(-0.413)#16,237 |
| 30. | 90006 | 0.18% | 1.4%(-1.23)#967 | 0.61%(-0.427)#16,447 |
| 31. | 90047 | 0.17% | 1.4%(-1.24)#979 | 0.61%(-0.432)#16,525 |
| 32. | 90044 | 0.17% | 1.4%(-1.24)#986 | 0.61%(-0.438)#16,617 |
| 33. | 90065 | 0.16% | 1.4%(-1.25)#992 | 0.61%(-0.443)#16,699 |
| 34. | 90019 | 0.15% | 1.4%(-1.26)#1,005 | 0.61%(-0.451)#16,846 |
| 35. | 90048 | 0.15% | 1.4%(-1.26)#1,015 | 0.61%(-0.455)#16,906 |
| 36. | 90045 | 0.15% | 1.4%(-1.26)#1,021 | 0.61%(-0.459)#16,990 |
| 37. | 90026 | 0.14% | 1.4%(-1.27)#1,024 | 0.61%(-0.463)#17,049 |
| 38. | 90027 | 0.11% | 1.4%(-1.30)#1,061 | 0.61%(-0.496)#17,587 |
| 39. | 90036 | 0.069% | 1.4%(-1.34)#1,122 | 0.61%(-0.536)#18,310 |
| 40. | 90031 | 0.059% | 1.4%(-1.35)#1,130 | 0.61%(-0.547)#18,499 |
| 41. | 90025 | 0.057% | 1.4%(-1.35)#1,137 | 0.61%(-0.549)#18,542 |
| 42. | 90049 | 0.055% | 1.4%(-1.35)#1,140 | 0.61%(-0.550)#18,560 |
| 43. | 90029 | 0.038% | 1.4%(-1.37)#1,165 | 0.61%(-0.567)#18,832 |
| 44. | 90041 | 0.0068% | 1.4%(-1.40)#1,198 | 0.61%(-0.599)#19,189 |
1
Common Questions
What are the Top 10 Zip Codes with the Highest Percentage of Population Employed in Farming, Fishing & Forestry in Los Angeles, CA?
Top 10 Zip Codes with the Highest Percentage of Population Employed in Farming, Fishing & Forestry in Los Angeles, CA are:
What zip code has the Highest Percentage of Population Employed in Farming, Fishing & Forestry in Los Angeles, CA?
90059 has the Highest Percentage of Population Employed in Farming, Fishing & Forestry in Los Angeles, CA with 2.1%.
What is the Percentage of Population Employed in Farming, Fishing & Forestry in Los Angeles, CA?
Percentage of Population Employed in Farming, Fishing & Forestry in Los Angeles is 0.29%.
What is the Percentage of Population Employed in Farming, Fishing & Forestry in California?
Percentage of Population Employed in Farming, Fishing & Forestry in California is 1.4%.
What is the Percentage of Population Employed in Farming, Fishing & Forestry in the United States?
Percentage of Population Employed in Farming, Fishing & Forestry in the United States is 0.61%.