Zip Codes with the Highest Percentage of Population Employed in Farming, Fishing & Forestry in Turlock, CA
RELATED REPORTS & OPTIONS
Farming, Fishing & Forestry
Turlock
Compare Zip Codes
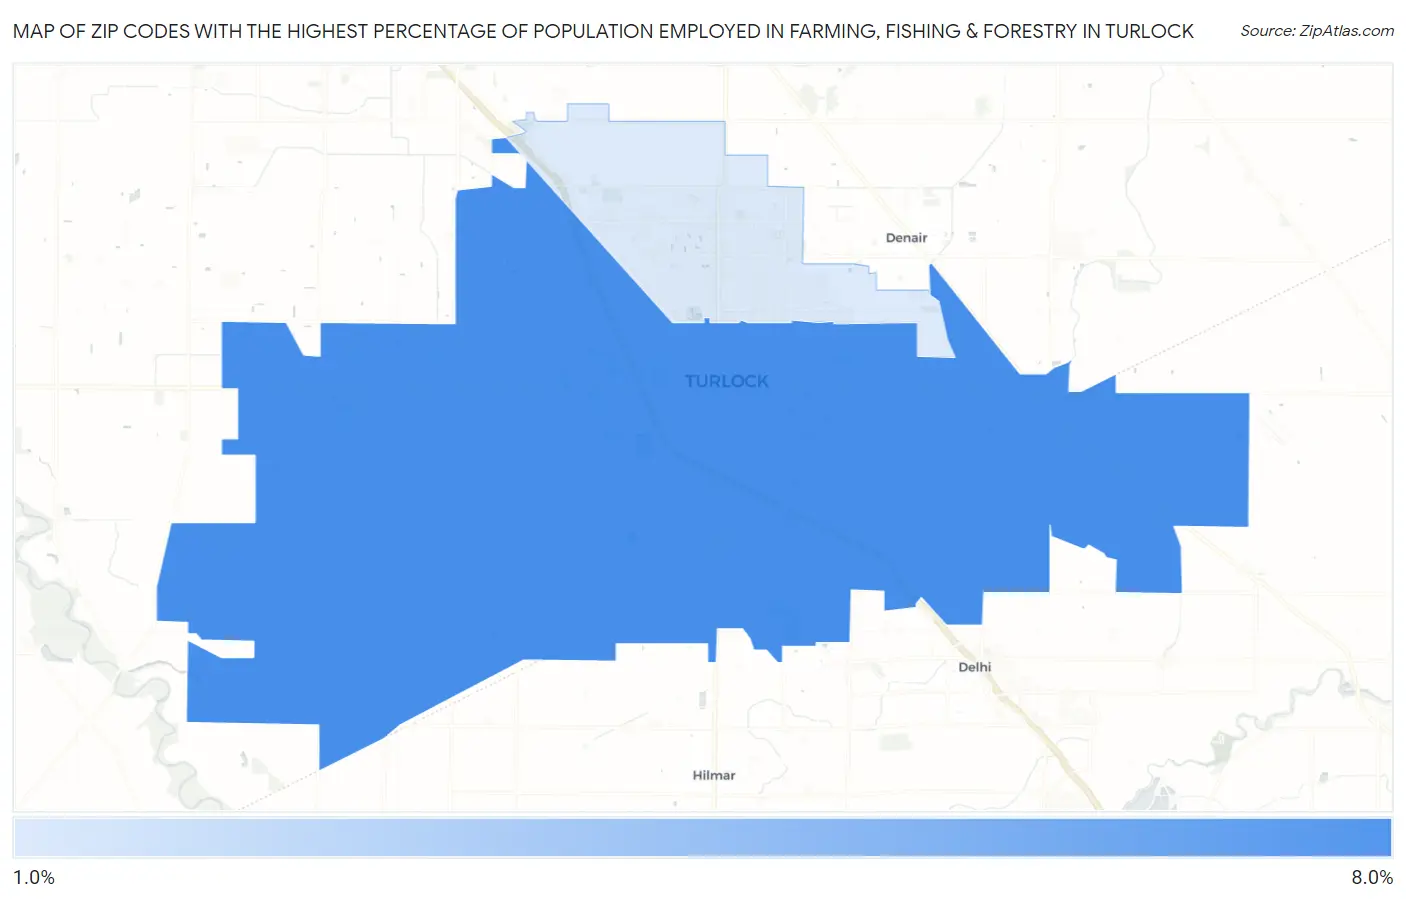
Map of Zip Codes with the Highest Percentage of Population Employed in Farming, Fishing & Forestry in Turlock
1.7%
6.5%
Zip Codes with the Highest Percentage of Population Employed in Farming, Fishing & Forestry in Turlock, CA
| Zip Code | % Employed | vs State | vs National | |
| 1. | 95380 | 6.5% | 1.4%(+5.08)#213 | 0.61%(+5.89)#2,161 |
| 2. | 95382 | 1.7% | 1.4%(+0.259)#401 | 0.61%(+1.06)#7,376 |
1
Common Questions
What are the Top Zip Codes with the Highest Percentage of Population Employed in Farming, Fishing & Forestry in Turlock, CA?
Top Zip Codes with the Highest Percentage of Population Employed in Farming, Fishing & Forestry in Turlock, CA are:
What zip code has the Highest Percentage of Population Employed in Farming, Fishing & Forestry in Turlock, CA?
95380 has the Highest Percentage of Population Employed in Farming, Fishing & Forestry in Turlock, CA with 6.5%.
What is the Percentage of Population Employed in Farming, Fishing & Forestry in Turlock, CA?
Percentage of Population Employed in Farming, Fishing & Forestry in Turlock is 3.3%.
What is the Percentage of Population Employed in Farming, Fishing & Forestry in California?
Percentage of Population Employed in Farming, Fishing & Forestry in California is 1.4%.
What is the Percentage of Population Employed in Farming, Fishing & Forestry in the United States?
Percentage of Population Employed in Farming, Fishing & Forestry in the United States is 0.61%.