Cities with the Highest Percentage of Population Employed in Farming, Fishing & Forestry in South Carolina
RELATED REPORTS & OPTIONS
Farming, Fishing & Forestry
South Carolina
Compare Cities
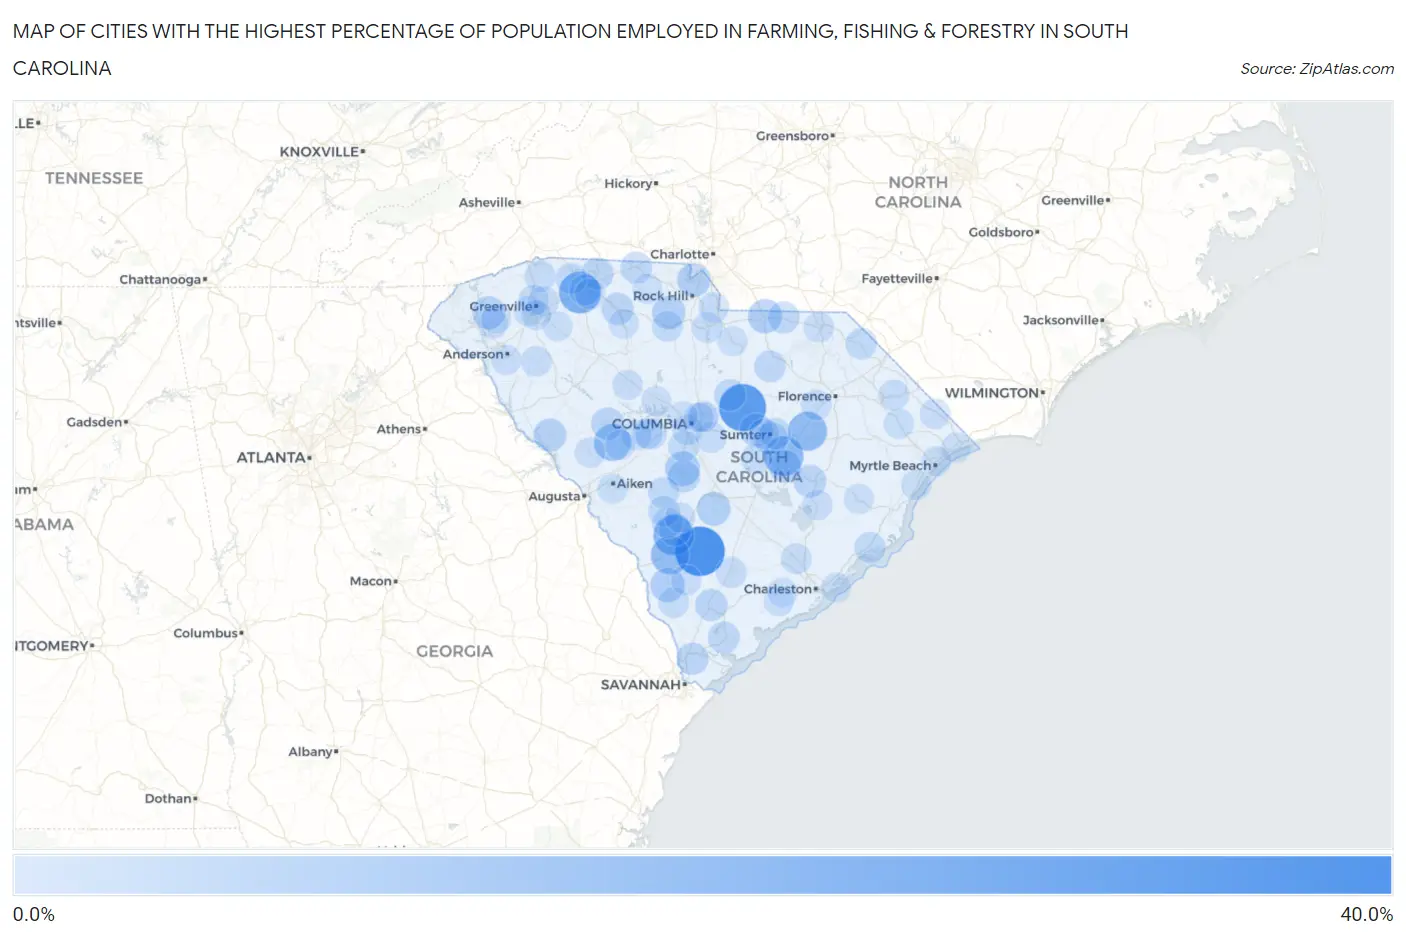
Map of Cities with the Highest Percentage of Population Employed in Farming, Fishing & Forestry in South Carolina
0.0%
40.0%
Cities with the Highest Percentage of Population Employed in Farming, Fishing & Forestry in South Carolina
| City | % Employed | vs State | vs National | |
| 1. | Lodge | 31.4% | 0.39%(+31.0)#1 | 0.61%(+30.8)#199 |
| 2. | Boykin | 27.5% | 0.39%(+27.1)#2 | 0.61%(+26.8)#265 |
| 3. | Fairforest | 18.9% | 0.39%(+18.5)#3 | 0.61%(+18.3)#476 |
| 4. | Olar | 16.7% | 0.39%(+16.3)#4 | 0.61%(+16.1)#568 |
| 5. | Alcolu | 15.1% | 0.39%(+14.7)#5 | 0.61%(+14.5)#637 |
| 6. | Shiloh | 14.3% | 0.39%(+13.9)#6 | 0.61%(+13.7)#682 |
| 7. | Sycamore | 13.0% | 0.39%(+12.7)#7 | 0.61%(+12.4)#783 |
| 8. | Ward | 10.9% | 0.39%(+10.5)#8 | 0.61%(+10.3)#964 |
| 9. | Dovesville | 9.0% | 0.39%(+8.63)#9 | 0.61%(+8.41)#1,225 |
| 10. | Hamer | 7.6% | 0.39%(+7.26)#10 | 0.61%(+7.04)#1,515 |
| 11. | Woodford | 7.5% | 0.39%(+7.08)#11 | 0.61%(+6.86)#1,552 |
| 12. | Luray | 6.7% | 0.39%(+6.34)#12 | 0.61%(+6.13)#1,722 |
| 13. | Pageland | 6.4% | 0.39%(+6.04)#13 | 0.61%(+5.82)#1,803 |
| 14. | Rowesville | 6.1% | 0.39%(+5.69)#14 | 0.61%(+5.48)#1,894 |
| 15. | Tega Cay | 5.6% | 0.39%(+5.19)#15 | 0.61%(+4.97)#2,062 |
| 16. | Lowrys | 5.6% | 0.39%(+5.17)#16 | 0.61%(+4.95)#2,072 |
| 17. | Cherryvale | 5.0% | 0.39%(+4.61)#17 | 0.61%(+4.39)#2,313 |
| 18. | Mccormick | 4.9% | 0.39%(+4.48)#18 | 0.61%(+4.26)#2,362 |
| 19. | South Sumter | 4.8% | 0.39%(+4.45)#19 | 0.61%(+4.24)#2,378 |
| 20. | Six Mile | 4.6% | 0.39%(+4.22)#20 | 0.61%(+4.00)#2,485 |
| 21. | Manning | 4.3% | 0.39%(+3.89)#21 | 0.61%(+3.68)#2,659 |
| 22. | Saluda | 4.1% | 0.39%(+3.75)#22 | 0.61%(+3.54)#2,741 |
| 23. | Greeleyville | 4.1% | 0.39%(+3.75)#23 | 0.61%(+3.53)#2,744 |
| 24. | Mayo | 3.6% | 0.39%(+3.23)#24 | 0.61%(+3.01)#3,111 |
| 25. | Yemassee | 3.6% | 0.39%(+3.19)#25 | 0.61%(+2.97)#3,140 |
| 26. | North | 3.6% | 0.39%(+3.16)#26 | 0.61%(+2.94)#3,178 |
| 27. | Hardeeville | 3.4% | 0.39%(+3.04)#27 | 0.61%(+2.83)#3,266 |
| 28. | Govan | 3.3% | 0.39%(+2.95)#28 | 0.61%(+2.73)#3,344 |
| 29. | Jonesville | 3.3% | 0.39%(+2.90)#29 | 0.61%(+2.68)#3,386 |
| 30. | Seabrook | 3.0% | 0.39%(+2.64)#30 | 0.61%(+2.42)#3,608 |
| 31. | Mount Croghan | 3.0% | 0.39%(+2.64)#31 | 0.61%(+2.42)#3,614 |
| 32. | Burton | 3.0% | 0.39%(+2.58)#32 | 0.61%(+2.36)#3,670 |
| 33. | Beech Island | 3.0% | 0.39%(+2.57)#33 | 0.61%(+2.35)#3,684 |
| 34. | Blacksburg | 2.8% | 0.39%(+2.40)#34 | 0.61%(+2.18)#3,856 |
| 35. | Lugoff | 2.8% | 0.39%(+2.37)#35 | 0.61%(+2.16)#3,882 |
| 36. | Bethune | 2.7% | 0.39%(+2.32)#36 | 0.61%(+2.10)#3,956 |
| 37. | Inman | 2.4% | 0.39%(+2.04)#37 | 0.61%(+1.82)#4,285 |
| 38. | East Sumter | 2.2% | 0.39%(+1.86)#38 | 0.61%(+1.64)#4,507 |
| 39. | Saxon | 2.2% | 0.39%(+1.84)#39 | 0.61%(+1.62)#4,537 |
| 40. | Springfield | 2.2% | 0.39%(+1.83)#40 | 0.61%(+1.62)#4,543 |
| 41. | Clio | 2.2% | 0.39%(+1.83)#41 | 0.61%(+1.61)#4,556 |
| 42. | Gilbert | 2.2% | 0.39%(+1.76)#42 | 0.61%(+1.54)#4,641 |
| 43. | Whitney | 2.1% | 0.39%(+1.74)#43 | 0.61%(+1.52)#4,685 |
| 44. | Mcclellanville | 2.1% | 0.39%(+1.70)#44 | 0.61%(+1.49)#4,725 |
| 45. | Wyboo | 2.0% | 0.39%(+1.61)#45 | 0.61%(+1.39)#4,883 |
| 46. | Gaston | 1.9% | 0.39%(+1.56)#46 | 0.61%(+1.34)#4,960 |
| 47. | Blackville | 1.8% | 0.39%(+1.43)#47 | 0.61%(+1.21)#5,153 |
| 48. | Gayle Mill | 1.6% | 0.39%(+1.26)#48 | 0.61%(+1.04)#5,470 |
| 49. | Arkwright | 1.6% | 0.39%(+1.18)#49 | 0.61%(+0.960)#5,633 |
| 50. | Tigerville | 1.5% | 0.39%(+1.13)#50 | 0.61%(+0.917)#5,718 |
| 51. | Walterboro | 1.5% | 0.39%(+1.07)#51 | 0.61%(+0.852)#5,854 |
| 52. | Hopkins | 1.5% | 0.39%(+1.07)#52 | 0.61%(+0.847)#5,865 |
| 53. | Furman | 1.4% | 0.39%(+0.995)#53 | 0.61%(+0.777)#6,009 |
| 54. | Pinewood | 1.3% | 0.39%(+0.958)#54 | 0.61%(+0.740)#6,095 |
| 55. | Hilda | 1.3% | 0.39%(+0.955)#55 | 0.61%(+0.737)#6,104 |
| 56. | Ladson | 1.3% | 0.39%(+0.883)#56 | 0.61%(+0.665)#6,283 |
| 57. | Fort Lawn | 1.2% | 0.39%(+0.855)#57 | 0.61%(+0.637)#6,366 |
| 58. | Woodfield | 1.2% | 0.39%(+0.793)#58 | 0.61%(+0.575)#6,520 |
| 59. | Timmonsville | 1.2% | 0.39%(+0.775)#59 | 0.61%(+0.557)#6,568 |
| 60. | Honea Path | 1.1% | 0.39%(+0.716)#60 | 0.61%(+0.498)#6,727 |
| 61. | Mullins | 1.1% | 0.39%(+0.697)#61 | 0.61%(+0.478)#6,790 |
| 62. | Cayce | 1.0% | 0.39%(+0.659)#62 | 0.61%(+0.441)#6,898 |
| 63. | Welcome | 1.0% | 0.39%(+0.629)#63 | 0.61%(+0.410)#6,992 |
| 64. | Sumter | 0.95% | 0.39%(+0.567)#64 | 0.61%(+0.349)#7,165 |
| 65. | Central | 0.94% | 0.39%(+0.556)#65 | 0.61%(+0.338)#7,201 |
| 66. | Edgefield | 0.90% | 0.39%(+0.516)#66 | 0.61%(+0.298)#7,325 |
| 67. | Varnville | 0.88% | 0.39%(+0.494)#67 | 0.61%(+0.276)#7,415 |
| 68. | Batesburg Leesville | 0.87% | 0.39%(+0.478)#68 | 0.61%(+0.260)#7,466 |
| 69. | Cheraw | 0.85% | 0.39%(+0.466)#69 | 0.61%(+0.248)#7,506 |
| 70. | St Stephen | 0.81% | 0.39%(+0.421)#70 | 0.61%(+0.203)#7,679 |
| 71. | Loris | 0.81% | 0.39%(+0.420)#71 | 0.61%(+0.202)#7,684 |
| 72. | Wade Hampton | 0.79% | 0.39%(+0.405)#72 | 0.61%(+0.187)#7,740 |
| 73. | Denmark | 0.77% | 0.39%(+0.382)#73 | 0.61%(+0.164)#7,822 |
| 74. | White Knoll | 0.73% | 0.39%(+0.340)#74 | 0.61%(+0.122)#7,992 |
| 75. | Van Wyck | 0.69% | 0.39%(+0.305)#75 | 0.61%(+0.086)#8,131 |
| 76. | Spartanburg | 0.65% | 0.39%(+0.267)#76 | 0.61%(+0.049)#8,274 |
| 77. | Summit | 0.65% | 0.39%(+0.258)#77 | 0.61%(+0.040)#8,311 |
| 78. | Aynor | 0.60% | 0.39%(+0.217)#78 | 0.61%(-0.001)#8,471 |
| 79. | Sans Souci | 0.59% | 0.39%(+0.199)#79 | 0.61%(-0.019)#8,560 |
| 80. | Meggett | 0.57% | 0.39%(+0.186)#80 | 0.61%(-0.032)#8,620 |
| 81. | Aiken | 0.56% | 0.39%(+0.176)#81 | 0.61%(-0.042)#8,668 |
| 82. | Homeland Park | 0.55% | 0.39%(+0.165)#82 | 0.61%(-0.053)#8,722 |
| 83. | Newberry | 0.52% | 0.39%(+0.137)#83 | 0.61%(-0.081)#8,855 |
| 84. | Union | 0.51% | 0.39%(+0.120)#84 | 0.61%(-0.098)#8,940 |
| 85. | Hickory Grove | 0.42% | 0.39%(+0.036)#85 | 0.61%(-0.182)#9,424 |
| 86. | Chapin | 0.40% | 0.39%(+0.010)#86 | 0.61%(-0.208)#9,565 |
| 87. | Fountain Inn | 0.39% | 0.39%(+0.006)#87 | 0.61%(-0.212)#9,582 |
| 88. | Columbia | 0.39% | 0.39%(+0.006)#88 | 0.61%(-0.212)#9,585 |
| 89. | North Myrtle Beach | 0.39% | 0.39%(+0.006)#89 | 0.61%(-0.213)#9,588 |
| 90. | Gantt | 0.39% | 0.39%(-0.002)#90 | 0.61%(-0.220)#9,636 |
| 91. | Andrews | 0.35% | 0.39%(-0.039)#91 | 0.61%(-0.257)#9,860 |
| 92. | Norris | 0.33% | 0.39%(-0.053)#92 | 0.61%(-0.271)#9,952 |
| 93. | Hollywood | 0.33% | 0.39%(-0.057)#93 | 0.61%(-0.275)#9,975 |
| 94. | Heath Springs | 0.31% | 0.39%(-0.081)#94 | 0.61%(-0.299)#10,118 |
| 95. | Ridge Spring | 0.30% | 0.39%(-0.084)#95 | 0.61%(-0.303)#10,144 |
| 96. | Murrells Inlet | 0.29% | 0.39%(-0.095)#96 | 0.61%(-0.313)#10,198 |
| 97. | St Andrews | 0.28% | 0.39%(-0.110)#97 | 0.61%(-0.328)#10,287 |
| 98. | Myrtle Beach | 0.28% | 0.39%(-0.111)#98 | 0.61%(-0.329)#10,295 |
| 99. | Isle Of Palms | 0.26% | 0.39%(-0.124)#99 | 0.61%(-0.343)#10,378 |
| 100. | Forest Acres | 0.25% | 0.39%(-0.137)#100 | 0.61%(-0.355)#10,455 |
Common Questions
What are the Top 10 Cities with the Highest Percentage of Population Employed in Farming, Fishing & Forestry in South Carolina?
Top 10 Cities with the Highest Percentage of Population Employed in Farming, Fishing & Forestry in South Carolina are:
What city has the Highest Percentage of Population Employed in Farming, Fishing & Forestry in South Carolina?
Lodge has the Highest Percentage of Population Employed in Farming, Fishing & Forestry in South Carolina with 31.4%.
What is the Percentage of Population Employed in Farming, Fishing & Forestry in the State of South Carolina?
Percentage of Population Employed in Farming, Fishing & Forestry in South Carolina is 0.39%.
What is the Percentage of Population Employed in Farming, Fishing & Forestry in the United States?
Percentage of Population Employed in Farming, Fishing & Forestry in the United States is 0.61%.