Cities with the Highest Percentage of Population Employed in Farming, Fishing & Forestry in North Carolina
RELATED REPORTS & OPTIONS
Farming, Fishing & Forestry
North Carolina
Compare Cities
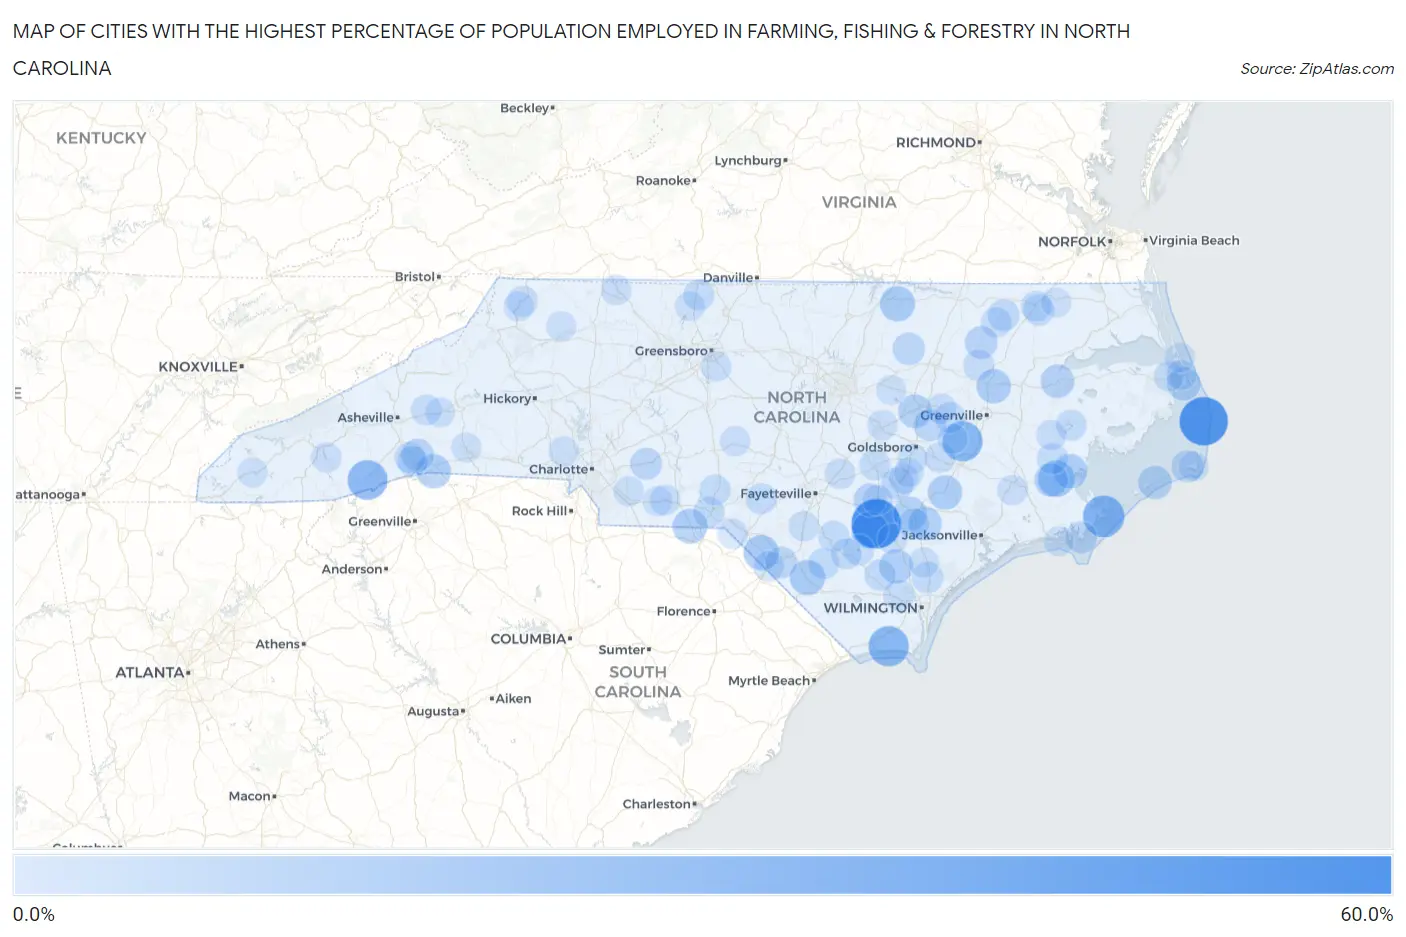
Map of Cities with the Highest Percentage of Population Employed in Farming, Fishing & Forestry in North Carolina
0.0%
60.0%
Cities with the Highest Percentage of Population Employed in Farming, Fishing & Forestry in North Carolina
| City | % Employed | vs State | vs National | |
| 1. | Ingold | 55.0% | 0.51%(+54.5)#1 | 0.61%(+54.4)#61 |
| 2. | Waves | 52.0% | 0.51%(+51.5)#2 | 0.61%(+51.4)#69 |
| 3. | Roberdel | 40.7% | 0.51%(+40.2)#3 | 0.61%(+40.1)#122 |
| 4. | Atlantic | 32.2% | 0.51%(+31.7)#4 | 0.61%(+31.6)#190 |
| 5. | Varnamtown | 29.0% | 0.51%(+28.5)#5 | 0.61%(+28.4)#235 |
| 6. | Bowdens | 29.0% | 0.51%(+28.5)#6 | 0.61%(+28.4)#236 |
| 7. | Hookerton | 29.0% | 0.51%(+28.5)#7 | 0.61%(+28.4)#238 |
| 8. | Rosman | 27.3% | 0.51%(+26.8)#8 | 0.61%(+26.7)#268 |
| 9. | Dudley | 19.2% | 0.51%(+18.7)#9 | 0.61%(+18.6)#466 |
| 10. | Garland | 19.1% | 0.51%(+18.6)#10 | 0.61%(+18.5)#470 |
| 11. | Bayboro | 18.6% | 0.51%(+18.1)#11 | 0.61%(+18.0)#488 |
| 12. | Raemon | 15.5% | 0.51%(+15.0)#12 | 0.61%(+14.9)#608 |
| 13. | Boardman | 15.4% | 0.51%(+14.9)#13 | 0.61%(+14.8)#618 |
| 14. | Warrenton | 15.1% | 0.51%(+14.6)#14 | 0.61%(+14.5)#638 |
| 15. | Mcfarlan | 14.0% | 0.51%(+13.4)#15 | 0.61%(+13.3)#716 |
| 16. | Mesic | 13.4% | 0.51%(+12.9)#16 | 0.61%(+12.8)#748 |
| 17. | Pink Hill | 13.3% | 0.51%(+12.7)#17 | 0.61%(+12.6)#760 |
| 18. | Parmele | 13.0% | 0.51%(+12.5)#18 | 0.61%(+12.4)#781 |
| 19. | Tryon | 12.9% | 0.51%(+12.4)#19 | 0.61%(+12.3)#796 |
| 20. | Atkinson | 12.2% | 0.51%(+11.7)#20 | 0.61%(+11.6)#848 |
| 21. | Magnolia | 11.2% | 0.51%(+10.7)#21 | 0.61%(+10.6)#925 |
| 22. | Wanchese | 11.1% | 0.51%(+10.6)#22 | 0.61%(+10.5)#932 |
| 23. | Greenevers | 11.1% | 0.51%(+10.6)#23 | 0.61%(+10.5)#946 |
| 24. | Plymouth | 11.0% | 0.51%(+10.5)#24 | 0.61%(+10.4)#952 |
| 25. | Lucama | 10.9% | 0.51%(+10.4)#25 | 0.61%(+10.3)#967 |
| 26. | Alliance | 10.8% | 0.51%(+10.3)#26 | 0.61%(+10.2)#978 |
| 27. | Ocracoke | 10.6% | 0.51%(+10.1)#27 | 0.61%(+9.96)#1,004 |
| 28. | Bonnetsville | 9.6% | 0.51%(+9.11)#28 | 0.61%(+9.01)#1,128 |
| 29. | Scotland Neck | 8.9% | 0.51%(+8.35)#29 | 0.61%(+8.25)#1,257 |
| 30. | Dana | 8.5% | 0.51%(+7.96)#30 | 0.61%(+7.86)#1,328 |
| 31. | Castalia | 7.9% | 0.51%(+7.36)#31 | 0.61%(+7.26)#1,460 |
| 32. | Faison | 7.6% | 0.51%(+7.07)#32 | 0.61%(+6.97)#1,526 |
| 33. | Glenwood | 7.5% | 0.51%(+6.97)#33 | 0.61%(+6.87)#1,549 |
| 34. | Eureka | 7.4% | 0.51%(+6.94)#34 | 0.61%(+6.84)#1,557 |
| 35. | Frisco | 7.4% | 0.51%(+6.92)#35 | 0.61%(+6.82)#1,565 |
| 36. | Mcdonald | 6.7% | 0.51%(+6.16)#36 | 0.61%(+6.06)#1,748 |
| 37. | Red Cross | 6.6% | 0.51%(+6.12)#37 | 0.61%(+6.02)#1,754 |
| 38. | Gloucester | 6.6% | 0.51%(+6.10)#38 | 0.61%(+6.00)#1,758 |
| 39. | Woodland | 6.4% | 0.51%(+5.91)#39 | 0.61%(+5.80)#1,805 |
| 40. | Rocky Point | 5.5% | 0.51%(+4.95)#40 | 0.61%(+4.85)#2,118 |
| 41. | Cofield | 5.0% | 0.51%(+4.49)#41 | 0.61%(+4.39)#2,300 |
| 42. | Bladenboro | 4.9% | 0.51%(+4.42)#42 | 0.61%(+4.32)#2,336 |
| 43. | Kelly | 4.9% | 0.51%(+4.35)#43 | 0.61%(+4.25)#2,367 |
| 44. | Cordova | 4.8% | 0.51%(+4.28)#44 | 0.61%(+4.18)#2,401 |
| 45. | White Oak | 4.6% | 0.51%(+4.11)#45 | 0.61%(+4.01)#2,479 |
| 46. | Five Points | 4.5% | 0.51%(+4.02)#46 | 0.61%(+3.92)#2,528 |
| 47. | Ellerbe | 4.5% | 0.51%(+3.97)#47 | 0.61%(+3.87)#2,552 |
| 48. | Newton Grove | 4.4% | 0.51%(+3.91)#48 | 0.61%(+3.81)#2,580 |
| 49. | Aurora | 4.4% | 0.51%(+3.89)#49 | 0.61%(+3.78)#2,596 |
| 50. | Walstonburg | 4.2% | 0.51%(+3.73)#50 | 0.61%(+3.63)#2,680 |
| 51. | Barker Heights | 4.2% | 0.51%(+3.68)#51 | 0.61%(+3.58)#2,712 |
| 52. | Stoneville | 4.1% | 0.51%(+3.64)#52 | 0.61%(+3.54)#2,742 |
| 53. | White Lake | 4.1% | 0.51%(+3.64)#53 | 0.61%(+3.53)#2,743 |
| 54. | Belhaven | 4.1% | 0.51%(+3.61)#54 | 0.61%(+3.51)#2,753 |
| 55. | Rose Hill | 4.1% | 0.51%(+3.55)#55 | 0.61%(+3.45)#2,793 |
| 56. | Elizabethtown | 4.0% | 0.51%(+3.46)#56 | 0.61%(+3.36)#2,845 |
| 57. | Northwest | 3.8% | 0.51%(+3.34)#57 | 0.61%(+3.24)#2,927 |
| 58. | Rowland | 3.8% | 0.51%(+3.26)#58 | 0.61%(+3.16)#2,986 |
| 59. | Speed | 3.7% | 0.51%(+3.20)#59 | 0.61%(+3.10)#3,044 |
| 60. | Montreat | 3.6% | 0.51%(+3.14)#60 | 0.61%(+3.04)#3,076 |
| 61. | East Flat Rock | 3.6% | 0.51%(+3.11)#61 | 0.61%(+3.00)#3,121 |
| 62. | Winton | 3.6% | 0.51%(+3.09)#62 | 0.61%(+2.99)#3,130 |
| 63. | Falcon | 3.6% | 0.51%(+3.07)#63 | 0.61%(+2.97)#3,154 |
| 64. | Jefferson | 3.5% | 0.51%(+3.04)#64 | 0.61%(+2.94)#3,183 |
| 65. | Rich Square | 3.4% | 0.51%(+2.93)#65 | 0.61%(+2.83)#3,262 |
| 66. | Polkton | 3.2% | 0.51%(+2.66)#66 | 0.61%(+2.56)#3,487 |
| 67. | La Grange | 3.1% | 0.51%(+2.61)#67 | 0.61%(+2.51)#3,537 |
| 68. | St Pauls | 3.1% | 0.51%(+2.60)#68 | 0.61%(+2.50)#3,549 |
| 69. | Clinton | 2.9% | 0.51%(+2.40)#69 | 0.61%(+2.30)#3,737 |
| 70. | Saratoga | 2.9% | 0.51%(+2.35)#70 | 0.61%(+2.25)#3,784 |
| 71. | Gibson | 2.7% | 0.51%(+2.19)#71 | 0.61%(+2.09)#3,975 |
| 72. | Robbins | 2.7% | 0.51%(+2.15)#72 | 0.61%(+2.05)#4,009 |
| 73. | River Bend | 2.6% | 0.51%(+2.13)#73 | 0.61%(+2.03)#4,030 |
| 74. | Bath | 2.6% | 0.51%(+2.06)#74 | 0.61%(+1.96)#4,116 |
| 75. | Manns Harbor | 2.5% | 0.51%(+2.02)#75 | 0.61%(+1.92)#4,175 |
| 76. | Cullowhee | 2.5% | 0.51%(+2.00)#76 | 0.61%(+1.90)#4,205 |
| 77. | Toast | 2.5% | 0.51%(+1.99)#77 | 0.61%(+1.89)#4,213 |
| 78. | Selma | 2.5% | 0.51%(+1.99)#78 | 0.61%(+1.89)#4,226 |
| 79. | Pleasant Garden | 2.5% | 0.51%(+1.98)#79 | 0.61%(+1.88)#4,231 |
| 80. | Manteo | 2.4% | 0.51%(+1.89)#80 | 0.61%(+1.79)#4,327 |
| 81. | Calypso | 2.4% | 0.51%(+1.88)#81 | 0.61%(+1.78)#4,343 |
| 82. | Brogden | 2.3% | 0.51%(+1.77)#82 | 0.61%(+1.67)#4,464 |
| 83. | Burgaw | 2.2% | 0.51%(+1.71)#83 | 0.61%(+1.61)#4,562 |
| 84. | Harrells | 2.2% | 0.51%(+1.69)#84 | 0.61%(+1.59)#4,575 |
| 85. | Unionville | 2.2% | 0.51%(+1.66)#85 | 0.61%(+1.56)#4,615 |
| 86. | Stanley | 2.1% | 0.51%(+1.64)#86 | 0.61%(+1.54)#4,648 |
| 87. | Snow Hill | 2.0% | 0.51%(+1.54)#87 | 0.61%(+1.44)#4,786 |
| 88. | Madison | 2.0% | 0.51%(+1.53)#88 | 0.61%(+1.43)#4,827 |
| 89. | Atlantic Beach | 2.0% | 0.51%(+1.50)#89 | 0.61%(+1.40)#4,860 |
| 90. | Kill Devil Hills | 2.0% | 0.51%(+1.46)#90 | 0.61%(+1.36)#4,926 |
| 91. | Ruth | 2.0% | 0.51%(+1.46)#91 | 0.61%(+1.36)#4,930 |
| 92. | Andrews | 1.9% | 0.51%(+1.43)#92 | 0.61%(+1.33)#4,975 |
| 93. | Peachland | 1.9% | 0.51%(+1.41)#93 | 0.61%(+1.31)#5,009 |
| 94. | West Jefferson | 1.9% | 0.51%(+1.37)#94 | 0.61%(+1.27)#5,079 |
| 95. | Old Fort | 1.8% | 0.51%(+1.33)#95 | 0.61%(+1.23)#5,132 |
| 96. | Hays | 1.8% | 0.51%(+1.32)#96 | 0.61%(+1.22)#5,145 |
| 97. | Buxton | 1.8% | 0.51%(+1.31)#97 | 0.61%(+1.21)#5,157 |
| 98. | Middlesex | 1.8% | 0.51%(+1.31)#98 | 0.61%(+1.21)#5,172 |
| 99. | Gatesville | 1.8% | 0.51%(+1.26)#99 | 0.61%(+1.16)#5,241 |
| 100. | Mount Olive | 1.7% | 0.51%(+1.21)#100 | 0.61%(+1.11)#5,330 |
Common Questions
What are the Top 10 Cities with the Highest Percentage of Population Employed in Farming, Fishing & Forestry in North Carolina?
Top 10 Cities with the Highest Percentage of Population Employed in Farming, Fishing & Forestry in North Carolina are:
What city has the Highest Percentage of Population Employed in Farming, Fishing & Forestry in North Carolina?
Ingold has the Highest Percentage of Population Employed in Farming, Fishing & Forestry in North Carolina with 55.0%.
What is the Percentage of Population Employed in Farming, Fishing & Forestry in the State of North Carolina?
Percentage of Population Employed in Farming, Fishing & Forestry in North Carolina is 0.51%.
What is the Percentage of Population Employed in Farming, Fishing & Forestry in the United States?
Percentage of Population Employed in Farming, Fishing & Forestry in the United States is 0.61%.