Zip Codes with the Highest Percentage of Population Employed in Farming, Fishing & Forestry in San Jose, CA
RELATED REPORTS & OPTIONS
Farming, Fishing & Forestry
San Jose
Compare Zip Codes
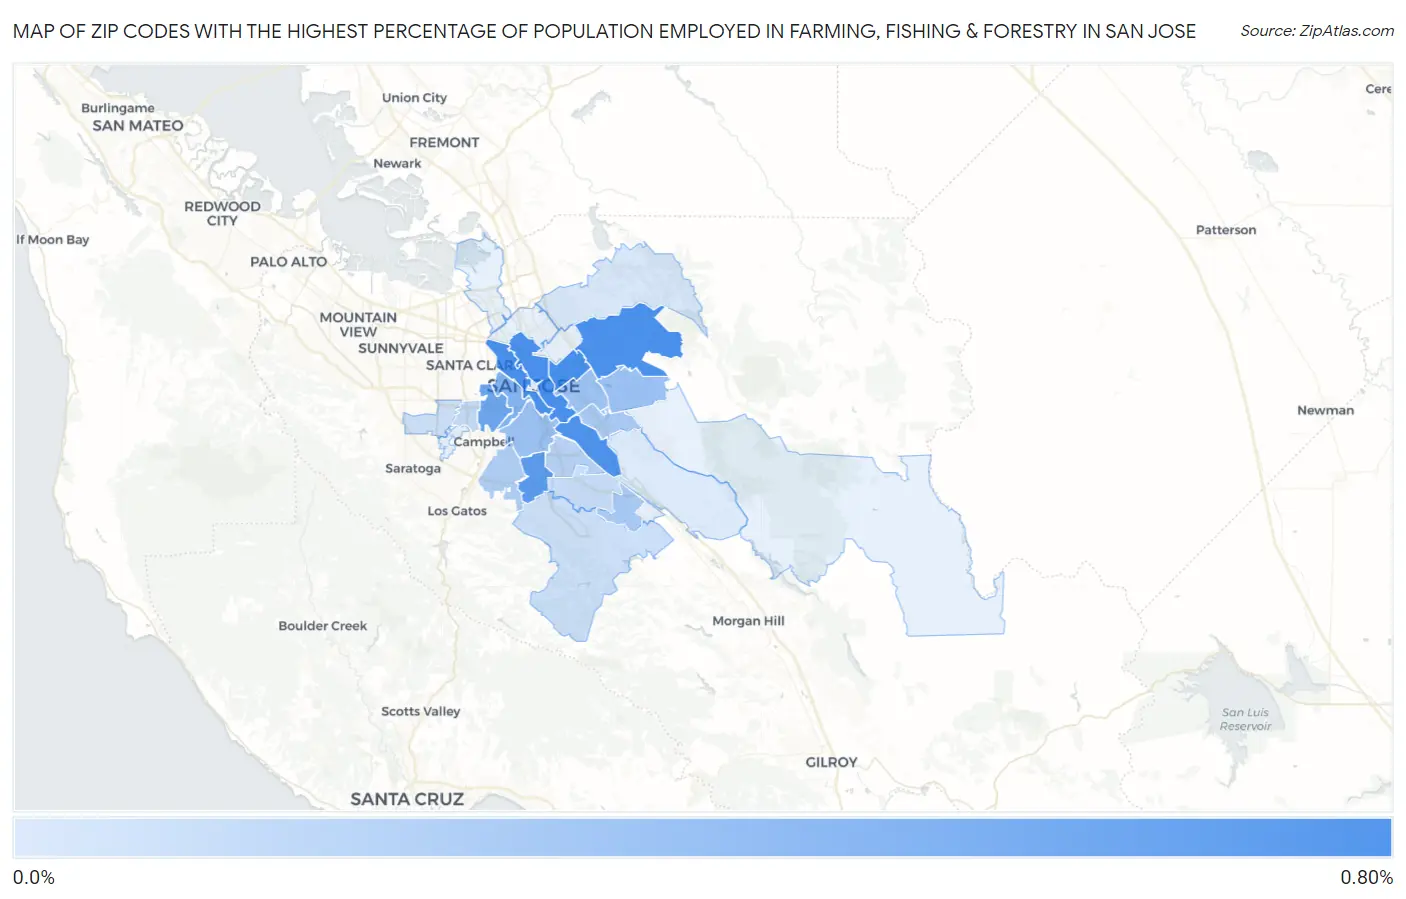
Map of Zip Codes with the Highest Percentage of Population Employed in Farming, Fishing & Forestry in San Jose
0.020%
0.73%
Zip Codes with the Highest Percentage of Population Employed in Farming, Fishing & Forestry in San Jose, CA
| Zip Code | % Employed | vs State | vs National | |
| 1. | 95116 | 0.73% | 1.4%(-0.676)#576 | 0.61%(+0.129)#11,172 |
| 2. | 95112 | 0.72% | 1.4%(-0.690)#578 | 0.61%(+0.115)#11,252 |
| 3. | 95127 | 0.72% | 1.4%(-0.694)#579 | 0.61%(+0.111)#11,275 |
| 4. | 95110 | 0.71% | 1.4%(-0.703)#583 | 0.61%(+0.102)#11,336 |
| 5. | 95111 | 0.70% | 1.4%(-0.711)#587 | 0.61%(+0.094)#11,386 |
| 6. | 95118 | 0.63% | 1.4%(-0.778)#616 | 0.61%(+0.027)#11,799 |
| 7. | 95128 | 0.55% | 1.4%(-0.863)#665 | 0.61%(-0.058)#12,457 |
| 8. | 95126 | 0.44% | 1.4%(-0.970)#723 | 0.61%(-0.165)#13,383 |
| 9. | 95148 | 0.34% | 1.4%(-1.07)#804 | 0.61%(-0.262)#14,330 |
| 10. | 95125 | 0.34% | 1.4%(-1.07)#805 | 0.61%(-0.263)#14,334 |
| 11. | 95122 | 0.32% | 1.4%(-1.09)#832 | 0.61%(-0.289)#14,633 |
| 12. | 95119 | 0.27% | 1.4%(-1.14)#867 | 0.61%(-0.331)#15,115 |
| 13. | 95121 | 0.26% | 1.4%(-1.15)#880 | 0.61%(-0.347)#15,293 |
| 14. | 95124 | 0.23% | 1.4%(-1.18)#927 | 0.61%(-0.380)#15,757 |
| 15. | 95136 | 0.19% | 1.4%(-1.22)#951 | 0.61%(-0.412)#16,231 |
| 16. | 95117 | 0.14% | 1.4%(-1.27)#1,025 | 0.61%(-0.463)#17,050 |
| 17. | 95123 | 0.12% | 1.4%(-1.29)#1,049 | 0.61%(-0.486)#17,450 |
| 18. | 95120 | 0.10% | 1.4%(-1.31)#1,072 | 0.61%(-0.504)#17,735 |
| 19. | 95129 | 0.085% | 1.4%(-1.33)#1,102 | 0.61%(-0.520)#18,013 |
| 20. | 95132 | 0.036% | 1.4%(-1.37)#1,169 | 0.61%(-0.569)#18,869 |
| 21. | 95138 | 0.020% | 1.4%(-1.39)#1,190 | 0.61%(-0.586)#19,077 |
1
Common Questions
What are the Top 10 Zip Codes with the Highest Percentage of Population Employed in Farming, Fishing & Forestry in San Jose, CA?
Top 10 Zip Codes with the Highest Percentage of Population Employed in Farming, Fishing & Forestry in San Jose, CA are:
What zip code has the Highest Percentage of Population Employed in Farming, Fishing & Forestry in San Jose, CA?
95116 has the Highest Percentage of Population Employed in Farming, Fishing & Forestry in San Jose, CA with 0.73%.
What is the Percentage of Population Employed in Farming, Fishing & Forestry in San Jose, CA?
Percentage of Population Employed in Farming, Fishing & Forestry in San Jose is 0.33%.
What is the Percentage of Population Employed in Farming, Fishing & Forestry in California?
Percentage of Population Employed in Farming, Fishing & Forestry in California is 1.4%.
What is the Percentage of Population Employed in Farming, Fishing & Forestry in the United States?
Percentage of Population Employed in Farming, Fishing & Forestry in the United States is 0.61%.