Cities with the Highest Percentage of Population Employed in Farming, Fishing & Forestry in Vermont
RELATED REPORTS & OPTIONS
Farming, Fishing & Forestry
Vermont
Compare Cities
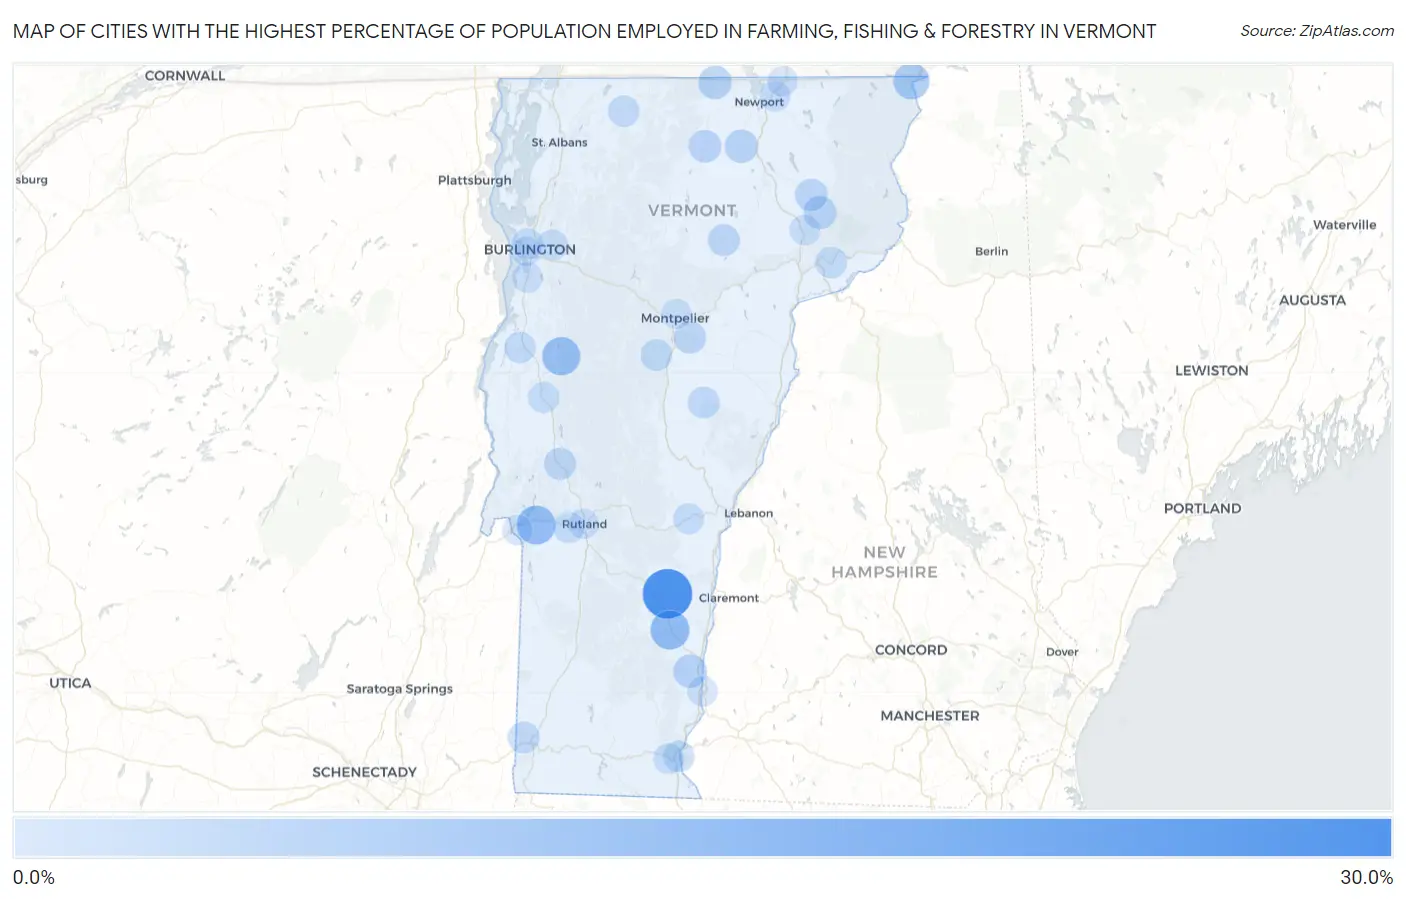
Map of Cities with the Highest Percentage of Population Employed in Farming, Fishing & Forestry in Vermont
0.0%
30.0%
Cities with the Highest Percentage of Population Employed in Farming, Fishing & Forestry in Vermont
| City | % Employed | vs State | vs National | |
| 1. | Cavendish | 25.3% | 1.2%(+24.0)#1 | 0.61%(+24.6)#318 |
| 2. | Whitingham | 13.0% | 1.2%(+11.8)#2 | 0.61%(+12.4)#782 |
| 3. | Chester | 11.2% | 1.2%(+9.98)#3 | 0.61%(+10.6)#928 |
| 4. | Castleton | 10.9% | 1.2%(+9.71)#4 | 0.61%(+10.3)#962 |
| 5. | Bristol | 10.2% | 1.2%(+9.01)#5 | 0.61%(+9.64)#1,044 |
| 6. | Westford | 8.6% | 1.2%(+7.37)#6 | 0.61%(+8.00)#1,298 |
| 7. | Canaan | 7.6% | 1.2%(+6.41)#7 | 0.61%(+7.03)#1,518 |
| 8. | Saxtons River | 4.2% | 1.2%(+2.98)#8 | 0.61%(+3.61)#2,694 |
| 9. | North Troy | 4.1% | 1.2%(+2.87)#9 | 0.61%(+3.50)#2,761 |
| 10. | Irasburg | 3.7% | 1.2%(+2.52)#10 | 0.61%(+3.14)#3,002 |
| 11. | East Burke | 3.6% | 1.2%(+2.38)#11 | 0.61%(+3.01)#3,118 |
| 12. | Lowell | 3.2% | 1.2%(+1.99)#12 | 0.61%(+2.62)#3,440 |
| 13. | West Burke | 2.9% | 1.2%(+1.71)#13 | 0.61%(+2.34)#3,695 |
| 14. | Barre | 2.5% | 1.2%(+1.26)#14 | 0.61%(+1.89)#4,224 |
| 15. | Brandon | 2.4% | 1.2%(+1.16)#15 | 0.61%(+1.79)#4,331 |
| 16. | Hardwick | 2.4% | 1.2%(+1.16)#16 | 0.61%(+1.78)#4,334 |
| 17. | North Bennington | 2.2% | 1.2%(+0.996)#17 | 0.61%(+1.62)#4,531 |
| 18. | Chelsea | 2.1% | 1.2%(+0.906)#18 | 0.61%(+1.53)#4,655 |
| 19. | Sheffield | 2.1% | 1.2%(+0.850)#19 | 0.61%(+1.48)#4,737 |
| 20. | Northfield | 2.0% | 1.2%(+0.815)#20 | 0.61%(+1.44)#4,789 |
| 21. | Enosburg Falls | 1.9% | 1.2%(+0.713)#21 | 0.61%(+1.34)#4,956 |
| 22. | Concord | 1.8% | 1.2%(+0.568)#22 | 0.61%(+1.20)#5,188 |
| 23. | Vergennes | 1.6% | 1.2%(+0.399)#23 | 0.61%(+1.03)#5,502 |
| 24. | Brattleboro | 1.6% | 1.2%(+0.382)#24 | 0.61%(+1.01)#5,523 |
| 25. | Middlebury | 1.4% | 1.2%(+0.152)#25 | 0.61%(+0.780)#6,004 |
| 26. | West Rutland | 1.4% | 1.2%(+0.145)#26 | 0.61%(+0.773)#6,017 |
| 27. | Burlington | 1.3% | 1.2%(+0.067)#27 | 0.61%(+0.695)#6,207 |
| 28. | Woodstock | 1.2% | 1.2%(-0.043)#28 | 0.61%(+0.585)#6,497 |
| 29. | Essex Junction | 0.95% | 1.2%(-0.286)#29 | 0.61%(+0.342)#7,193 |
| 30. | West Brattleboro | 0.90% | 1.2%(-0.334)#30 | 0.61%(+0.293)#7,350 |
| 31. | Lyndonville | 0.76% | 1.2%(-0.470)#31 | 0.61%(+0.158)#7,851 |
| 32. | Derby Center | 0.75% | 1.2%(-0.487)#32 | 0.61%(+0.141)#7,920 |
| 33. | Derby Line | 0.69% | 1.2%(-0.546)#33 | 0.61%(+0.082)#8,150 |
| 34. | Shelburne | 0.58% | 1.2%(-0.653)#34 | 0.61%(-0.025)#8,583 |
| 35. | Rutland | 0.39% | 1.2%(-0.839)#35 | 0.61%(-0.211)#9,580 |
| 36. | Westminster | 0.37% | 1.2%(-0.862)#36 | 0.61%(-0.234)#9,722 |
| 37. | Fair Haven | 0.33% | 1.2%(-0.904)#37 | 0.61%(-0.277)#9,988 |
| 38. | Montpelier | 0.16% | 1.2%(-1.08)#38 | 0.61%(-0.450)#11,087 |
| 39. | South Burlington | 0.076% | 1.2%(-1.16)#39 | 0.61%(-0.530)#11,645 |
1
2Common Questions
What are the Top 10 Cities with the Highest Percentage of Population Employed in Farming, Fishing & Forestry in Vermont?
Top 10 Cities with the Highest Percentage of Population Employed in Farming, Fishing & Forestry in Vermont are:
#1
25.3%
#2
11.2%
#3
10.9%
#4
10.2%
#5
7.6%
#6
4.2%
#7
4.1%
#8
3.7%
#9
3.6%
#10
3.2%
What city has the Highest Percentage of Population Employed in Farming, Fishing & Forestry in Vermont?
Cavendish has the Highest Percentage of Population Employed in Farming, Fishing & Forestry in Vermont with 25.3%.
What is the Percentage of Population Employed in Farming, Fishing & Forestry in the State of Vermont?
Percentage of Population Employed in Farming, Fishing & Forestry in Vermont is 1.2%.
What is the Percentage of Population Employed in Farming, Fishing & Forestry in the United States?
Percentage of Population Employed in Farming, Fishing & Forestry in the United States is 0.61%.