Zip Codes with the Highest Percentage of Population Employed in Farming, Fishing & Forestry in San Gabriel, CA
RELATED REPORTS & OPTIONS
Farming, Fishing & Forestry
San Gabriel
Compare Zip Codes
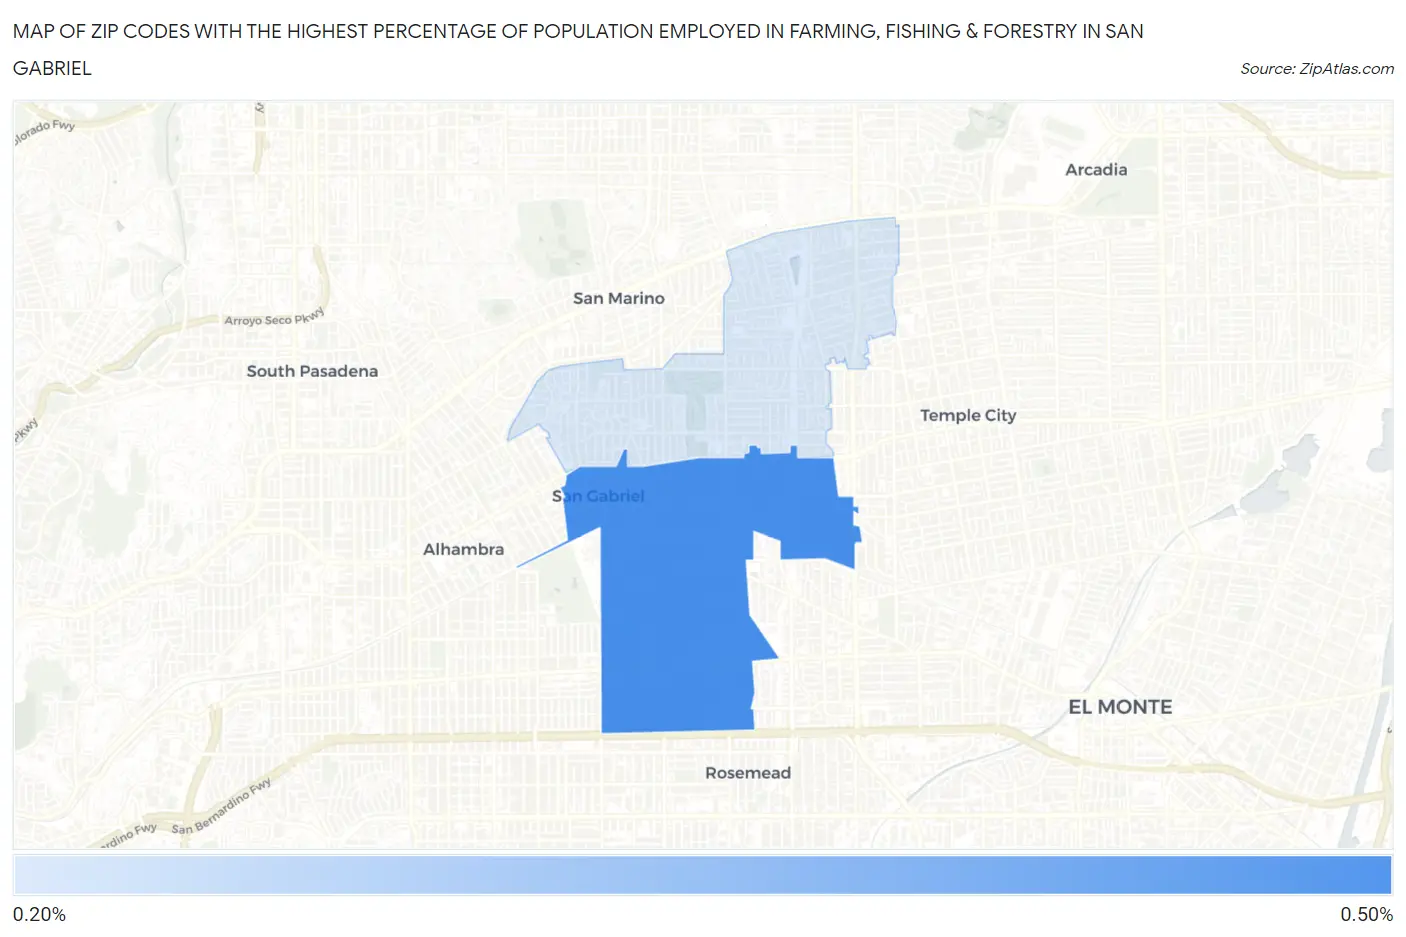
Map of Zip Codes with the Highest Percentage of Population Employed in Farming, Fishing & Forestry in San Gabriel
0.26%
0.45%
Zip Codes with the Highest Percentage of Population Employed in Farming, Fishing & Forestry in San Gabriel, CA
| Zip Code | % Employed | vs State | vs National | |
| 1. | 91776 | 0.45% | 1.4%(-0.965)#718 | 0.61%(-0.160)#13,327 |
| 2. | 91775 | 0.26% | 1.4%(-1.15)#879 | 0.61%(-0.345)#15,280 |
1
Common Questions
What are the Top Zip Codes with the Highest Percentage of Population Employed in Farming, Fishing & Forestry in San Gabriel, CA?
Top Zip Codes with the Highest Percentage of Population Employed in Farming, Fishing & Forestry in San Gabriel, CA are:
What zip code has the Highest Percentage of Population Employed in Farming, Fishing & Forestry in San Gabriel, CA?
91776 has the Highest Percentage of Population Employed in Farming, Fishing & Forestry in San Gabriel, CA with 0.45%.
What is the Percentage of Population Employed in Farming, Fishing & Forestry in San Gabriel, CA?
Percentage of Population Employed in Farming, Fishing & Forestry in San Gabriel is 0.27%.
What is the Percentage of Population Employed in Farming, Fishing & Forestry in California?
Percentage of Population Employed in Farming, Fishing & Forestry in California is 1.4%.
What is the Percentage of Population Employed in Farming, Fishing & Forestry in the United States?
Percentage of Population Employed in Farming, Fishing & Forestry in the United States is 0.61%.