Cities with the Highest Percentage of Population Employed in Farming, Fishing & Forestry in Idaho
RELATED REPORTS & OPTIONS
Farming, Fishing & Forestry
Idaho
Compare Cities
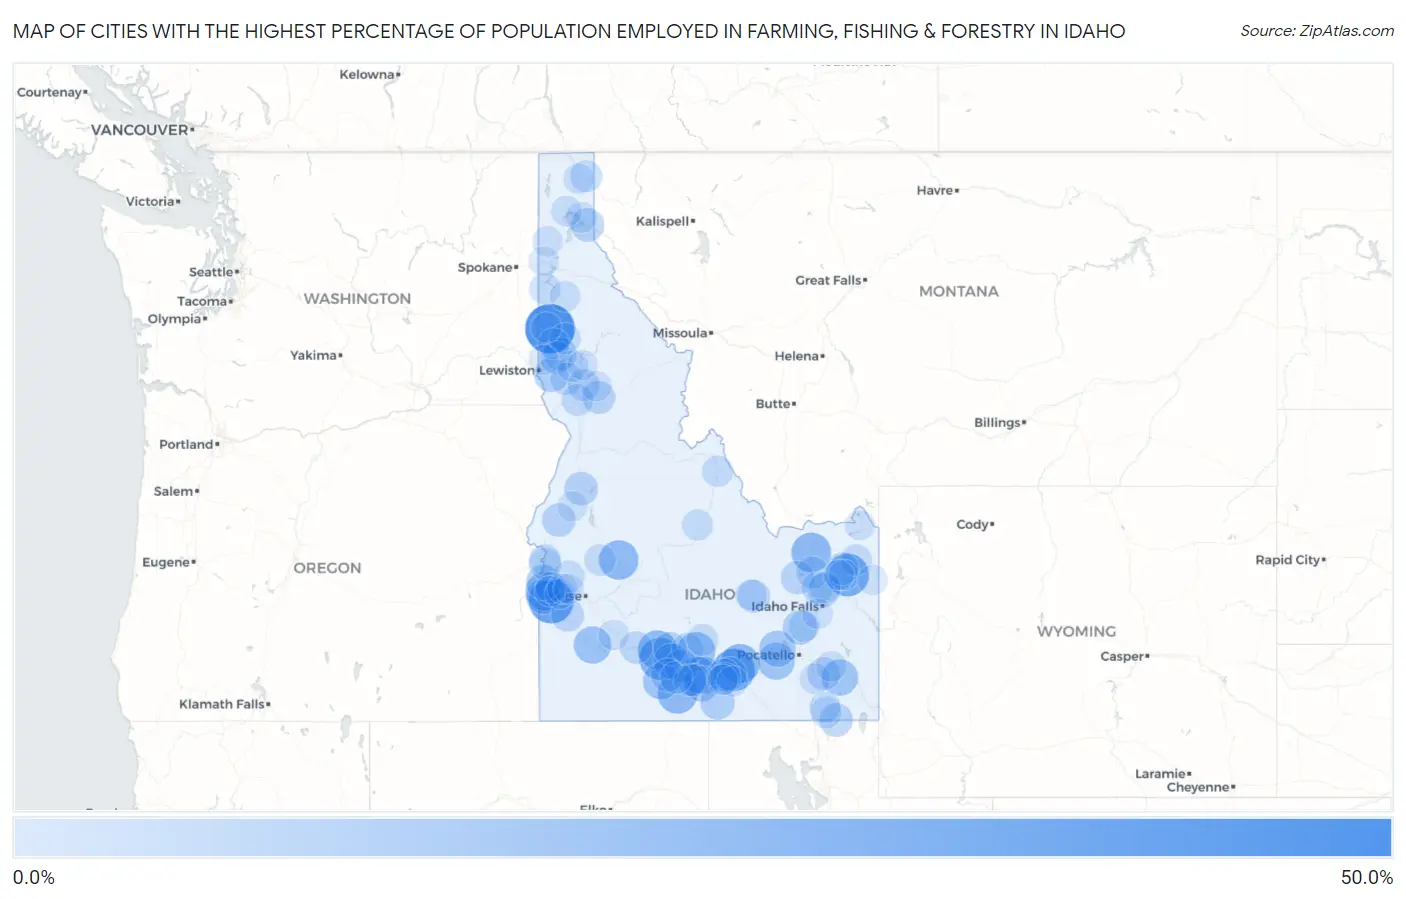
Map of Cities with the Highest Percentage of Population Employed in Farming, Fishing & Forestry in Idaho
0.0%
50.0%
Cities with the Highest Percentage of Population Employed in Farming, Fishing & Forestry in Idaho
| City | % Employed | vs State | vs National | |
| 1. | Princeton | 44.1% | 2.0%(+42.2)#1 | 0.61%(+43.5)#102 |
| 2. | Marsing | 33.0% | 2.0%(+31.0)#2 | 0.61%(+32.4)#181 |
| 3. | Newdale | 29.1% | 2.0%(+27.1)#3 | 0.61%(+28.5)#232 |
| 4. | Acequia | 28.3% | 2.0%(+26.3)#4 | 0.61%(+27.7)#252 |
| 5. | Hagerman | 26.8% | 2.0%(+24.8)#5 | 0.61%(+26.2)#283 |
| 6. | Hollister | 22.3% | 2.0%(+20.3)#6 | 0.61%(+21.7)#375 |
| 7. | Minidoka | 22.0% | 2.0%(+20.0)#7 | 0.61%(+21.4)#386 |
| 8. | Dubois | 22.0% | 2.0%(+20.0)#8 | 0.61%(+21.3)#388 |
| 9. | Lowman | 21.4% | 2.0%(+19.4)#9 | 0.61%(+20.8)#400 |
| 10. | Bliss | 21.3% | 2.0%(+19.3)#10 | 0.61%(+20.7)#403 |
| 11. | Wilder | 20.3% | 2.0%(+18.3)#11 | 0.61%(+19.7)#436 |
| 12. | Dietrich | 18.8% | 2.0%(+16.8)#12 | 0.61%(+18.1)#482 |
| 13. | Hazelton | 17.7% | 2.0%(+15.7)#13 | 0.61%(+17.1)#529 |
| 14. | Grand View | 17.3% | 2.0%(+15.3)#14 | 0.61%(+16.7)#549 |
| 15. | American Falls | 16.1% | 2.0%(+14.1)#15 | 0.61%(+15.5)#590 |
| 16. | Castleford | 15.4% | 2.0%(+13.4)#16 | 0.61%(+14.8)#619 |
| 17. | Eden | 15.0% | 2.0%(+13.0)#17 | 0.61%(+14.4)#646 |
| 18. | Grace | 14.8% | 2.0%(+12.9)#18 | 0.61%(+14.2)#653 |
| 19. | Aberdeen | 14.6% | 2.0%(+12.6)#19 | 0.61%(+14.0)#664 |
| 20. | Wendell | 12.8% | 2.0%(+10.9)#20 | 0.61%(+12.2)#798 |
| 21. | Murtaugh | 12.8% | 2.0%(+10.8)#21 | 0.61%(+12.2)#801 |
| 22. | Homedale | 12.7% | 2.0%(+10.7)#22 | 0.61%(+12.1)#808 |
| 23. | Parma | 12.6% | 2.0%(+10.6)#23 | 0.61%(+12.0)#813 |
| 24. | Moreland | 10.9% | 2.0%(+8.91)#24 | 0.61%(+10.3)#966 |
| 25. | Oakley | 10.5% | 2.0%(+8.56)#25 | 0.61%(+9.94)#1,006 |
| 26. | Sweetwater | 10.3% | 2.0%(+8.36)#26 | 0.61%(+9.74)#1,028 |
| 27. | Jerome | 9.0% | 2.0%(+6.98)#27 | 0.61%(+8.36)#1,234 |
| 28. | New Meadows | 8.8% | 2.0%(+6.86)#28 | 0.61%(+8.24)#1,259 |
| 29. | Clark Fork | 8.8% | 2.0%(+6.83)#29 | 0.61%(+8.21)#1,266 |
| 30. | Franklin | 8.6% | 2.0%(+6.59)#30 | 0.61%(+7.97)#1,302 |
| 31. | Cambridge | 8.6% | 2.0%(+6.58)#31 | 0.61%(+7.97)#1,307 |
| 32. | Gooding | 8.4% | 2.0%(+6.44)#32 | 0.61%(+7.82)#1,334 |
| 33. | Mud Lake | 8.4% | 2.0%(+6.39)#33 | 0.61%(+7.77)#1,343 |
| 34. | Buhl | 8.3% | 2.0%(+6.34)#34 | 0.61%(+7.72)#1,364 |
| 35. | Kendrick | 8.2% | 2.0%(+6.21)#35 | 0.61%(+7.59)#1,381 |
| 36. | Lewisville | 8.1% | 2.0%(+6.08)#36 | 0.61%(+7.46)#1,414 |
| 37. | Rupert | 8.0% | 2.0%(+6.02)#37 | 0.61%(+7.40)#1,429 |
| 38. | Stites | 7.7% | 2.0%(+5.71)#38 | 0.61%(+7.09)#1,496 |
| 39. | Paul | 7.6% | 2.0%(+5.66)#39 | 0.61%(+7.04)#1,517 |
| 40. | Melba | 7.5% | 2.0%(+5.54)#40 | 0.61%(+6.93)#1,539 |
| 41. | Lava Hot Springs | 7.5% | 2.0%(+5.47)#41 | 0.61%(+6.85)#1,555 |
| 42. | Butte City | 7.4% | 2.0%(+5.42)#42 | 0.61%(+6.80)#1,572 |
| 43. | Juliaetta | 7.2% | 2.0%(+5.23)#43 | 0.61%(+6.61)#1,611 |
| 44. | Hansen | 7.0% | 2.0%(+5.01)#44 | 0.61%(+6.39)#1,662 |
| 45. | Kimberly | 6.8% | 2.0%(+4.84)#45 | 0.61%(+6.22)#1,704 |
| 46. | Glenns Ferry | 6.6% | 2.0%(+4.57)#46 | 0.61%(+5.95)#1,770 |
| 47. | St Anthony | 6.5% | 2.0%(+4.54)#47 | 0.61%(+5.92)#1,775 |
| 48. | Filer | 6.2% | 2.0%(+4.21)#48 | 0.61%(+5.60)#1,859 |
| 49. | Fruitland | 6.1% | 2.0%(+4.14)#49 | 0.61%(+5.52)#1,881 |
| 50. | Reubens | 5.9% | 2.0%(+3.90)#50 | 0.61%(+5.28)#1,968 |
| 51. | Hamer | 5.9% | 2.0%(+3.90)#51 | 0.61%(+5.28)#1,971 |
| 52. | Nezperce | 5.7% | 2.0%(+3.71)#52 | 0.61%(+5.09)#2,022 |
| 53. | Moyie Springs | 5.4% | 2.0%(+3.46)#53 | 0.61%(+4.84)#2,127 |
| 54. | Roberts | 5.4% | 2.0%(+3.41)#54 | 0.61%(+4.79)#2,155 |
| 55. | Shoshone | 5.3% | 2.0%(+3.28)#55 | 0.61%(+4.66)#2,194 |
| 56. | Cottonwood | 5.2% | 2.0%(+3.16)#56 | 0.61%(+4.54)#2,244 |
| 57. | Richfield | 4.8% | 2.0%(+2.86)#57 | 0.61%(+4.24)#2,374 |
| 58. | Garden Valley | 4.8% | 2.0%(+2.85)#58 | 0.61%(+4.23)#2,383 |
| 59. | Heyburn | 4.8% | 2.0%(+2.78)#59 | 0.61%(+4.16)#2,407 |
| 60. | Gannett | 4.5% | 2.0%(+2.56)#60 | 0.61%(+3.94)#2,509 |
| 61. | Payette | 4.5% | 2.0%(+2.53)#61 | 0.61%(+3.91)#2,534 |
| 62. | Emmett | 4.4% | 2.0%(+2.37)#62 | 0.61%(+3.75)#2,612 |
| 63. | Worley | 4.3% | 2.0%(+2.36)#63 | 0.61%(+3.74)#2,620 |
| 64. | Peck | 4.3% | 2.0%(+2.36)#64 | 0.61%(+3.74)#2,623 |
| 65. | Deary | 4.3% | 2.0%(+2.35)#65 | 0.61%(+3.73)#2,634 |
| 66. | Menan | 4.3% | 2.0%(+2.33)#66 | 0.61%(+3.71)#2,639 |
| 67. | Salmon | 4.2% | 2.0%(+2.22)#67 | 0.61%(+3.60)#2,703 |
| 68. | Ashton | 4.2% | 2.0%(+2.21)#68 | 0.61%(+3.59)#2,708 |
| 69. | Dayton | 4.1% | 2.0%(+2.14)#69 | 0.61%(+3.52)#2,749 |
| 70. | Clifton | 4.0% | 2.0%(+2.03)#70 | 0.61%(+3.42)#2,811 |
| 71. | Arco | 4.0% | 2.0%(+1.97)#71 | 0.61%(+3.35)#2,857 |
| 72. | Challis | 3.8% | 2.0%(+1.82)#72 | 0.61%(+3.20)#2,962 |
| 73. | Groveland | 3.7% | 2.0%(+1.70)#73 | 0.61%(+3.08)#3,051 |
| 74. | Notus | 3.6% | 2.0%(+1.64)#74 | 0.61%(+3.02)#3,104 |
| 75. | Troy | 3.5% | 2.0%(+1.56)#75 | 0.61%(+2.94)#3,184 |
| 76. | Arimo | 3.4% | 2.0%(+1.39)#76 | 0.61%(+2.77)#3,306 |
| 77. | East Hope | 3.2% | 2.0%(+1.24)#77 | 0.61%(+2.62)#3,438 |
| 78. | St Maries | 3.0% | 2.0%(+0.976)#78 | 0.61%(+2.36)#3,682 |
| 79. | Bancroft | 2.9% | 2.0%(+0.870)#79 | 0.61%(+2.25)#3,783 |
| 80. | Ponderay | 2.8% | 2.0%(+0.767)#80 | 0.61%(+2.15)#3,890 |
| 81. | Greenleaf | 2.7% | 2.0%(+0.677)#81 | 0.61%(+2.06)#4,003 |
| 82. | Declo | 2.5% | 2.0%(+0.556)#82 | 0.61%(+1.94)#4,147 |
| 83. | Bonners Ferry | 2.5% | 2.0%(+0.492)#83 | 0.61%(+1.87)#4,241 |
| 84. | Burley | 2.5% | 2.0%(+0.489)#84 | 0.61%(+1.87)#4,243 |
| 85. | Spirit Lake | 2.4% | 2.0%(+0.443)#85 | 0.61%(+1.82)#4,286 |
| 86. | Teton | 2.4% | 2.0%(+0.413)#86 | 0.61%(+1.79)#4,320 |
| 87. | Shelley | 2.4% | 2.0%(+0.407)#87 | 0.61%(+1.79)#4,330 |
| 88. | Kamiah | 2.3% | 2.0%(+0.328)#88 | 0.61%(+1.71)#4,433 |
| 89. | Onaway | 2.3% | 2.0%(+0.312)#89 | 0.61%(+1.69)#4,447 |
| 90. | Mountain Home | 2.3% | 2.0%(+0.297)#90 | 0.61%(+1.68)#4,459 |
| 91. | Caldwell | 2.1% | 2.0%(+0.094)#91 | 0.61%(+1.48)#4,747 |
| 92. | Genesee | 2.0% | 2.0%(+0.028)#92 | 0.61%(+1.41)#4,852 |
| 93. | Council | 2.0% | 2.0%(-0.026)#93 | 0.61%(+1.36)#4,929 |
| 94. | Sugar City | 1.9% | 2.0%(-0.090)#94 | 0.61%(+1.29)#5,034 |
| 95. | Orofino | 1.9% | 2.0%(-0.124)#95 | 0.61%(+1.26)#5,098 |
| 96. | Tetonia | 1.8% | 2.0%(-0.201)#96 | 0.61%(+1.18)#5,212 |
| 97. | Middleton | 1.8% | 2.0%(-0.209)#97 | 0.61%(+1.17)#5,226 |
| 98. | Star | 1.7% | 2.0%(-0.253)#98 | 0.61%(+1.13)#5,305 |
| 99. | Island Park | 1.7% | 2.0%(-0.320)#99 | 0.61%(+1.06)#5,425 |
| 100. | Post Falls | 1.7% | 2.0%(-0.325)#100 | 0.61%(+1.06)#5,433 |
Common Questions
What are the Top 10 Cities with the Highest Percentage of Population Employed in Farming, Fishing & Forestry in Idaho?
Top 10 Cities with the Highest Percentage of Population Employed in Farming, Fishing & Forestry in Idaho are:
What city has the Highest Percentage of Population Employed in Farming, Fishing & Forestry in Idaho?
Princeton has the Highest Percentage of Population Employed in Farming, Fishing & Forestry in Idaho with 44.1%.
What is the Percentage of Population Employed in Farming, Fishing & Forestry in the State of Idaho?
Percentage of Population Employed in Farming, Fishing & Forestry in Idaho is 2.0%.
What is the Percentage of Population Employed in Farming, Fishing & Forestry in the United States?
Percentage of Population Employed in Farming, Fishing & Forestry in the United States is 0.61%.