Cities with the Highest Percentage of Population Employed in Farming, Fishing & Forestry in Massachusetts
RELATED REPORTS & OPTIONS
Farming, Fishing & Forestry
Massachusetts
Compare Cities
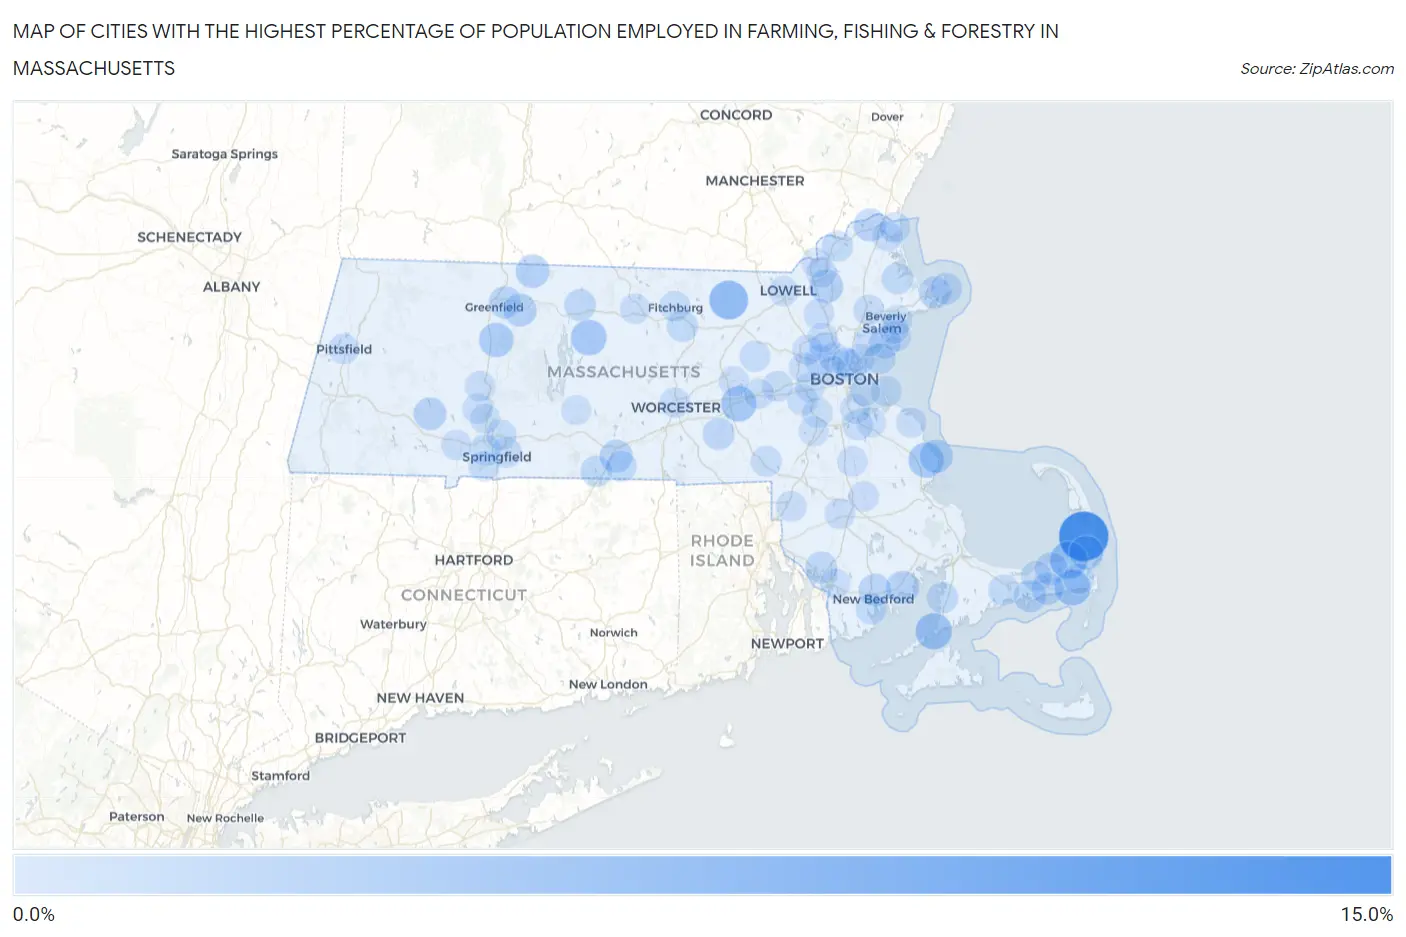
Map of Cities with the Highest Percentage of Population Employed in Farming, Fishing & Forestry in Massachusetts
0.0%
15.0%
Cities with the Highest Percentage of Population Employed in Farming, Fishing & Forestry in Massachusetts
| City | % Employed | vs State | vs National | |
| 1. | North Eastham | 10.0% | 0.22%(+9.80)#1 | 0.61%(+9.41)#1,064 |
| 2. | Oak Bluffs | 6.7% | 0.22%(+6.47)#2 | 0.61%(+6.08)#1,731 |
| 3. | Groton | 4.3% | 0.22%(+4.13)#3 | 0.61%(+3.74)#2,629 |
| 4. | Brewster | 3.6% | 0.22%(+3.43)#4 | 0.61%(+3.04)#3,080 |
| 5. | Woods Hole | 3.1% | 0.22%(+2.92)#5 | 0.61%(+2.53)#3,519 |
| 6. | Harwich Port | 3.0% | 0.22%(+2.75)#6 | 0.61%(+2.36)#3,675 |
| 7. | Petersham | 2.8% | 0.22%(+2.54)#7 | 0.61%(+2.15)#3,887 |
| 8. | Cordaville | 2.6% | 0.22%(+2.43)#8 | 0.61%(+2.04)#4,025 |
| 9. | Marshfield | 2.6% | 0.22%(+2.39)#9 | 0.61%(+2.00)#4,077 |
| 10. | South Deerfield | 2.1% | 0.22%(+1.91)#10 | 0.61%(+1.51)#4,694 |
| 11. | Orleans | 2.0% | 0.22%(+1.74)#11 | 0.61%(+1.35)#4,941 |
| 12. | Andover | 1.8% | 0.22%(+1.56)#12 | 0.61%(+1.17)#5,233 |
| 13. | Ocean Bluff Brant Rock | 1.7% | 0.22%(+1.48)#13 | 0.61%(+1.09)#5,362 |
| 14. | Northfield | 1.7% | 0.22%(+1.45)#14 | 0.61%(+1.05)#5,439 |
| 15. | Millers Falls | 1.5% | 0.22%(+1.28)#15 | 0.61%(+0.887)#5,770 |
| 16. | Mattapoisett Center | 1.5% | 0.22%(+1.26)#16 | 0.61%(+0.873)#5,808 |
| 17. | Sturbridge | 1.4% | 0.22%(+1.23)#17 | 0.61%(+0.840)#5,885 |
| 18. | East Dennis | 1.4% | 0.22%(+1.20)#18 | 0.61%(+0.810)#5,944 |
| 19. | Huntington | 1.4% | 0.22%(+1.14)#19 | 0.61%(+0.752)#6,069 |
| 20. | Amesbury Town | 1.3% | 0.22%(+1.12)#20 | 0.61%(+0.732)#6,115 |
| 21. | Greenfield | 1.2% | 0.22%(+0.992)#21 | 0.61%(+0.602)#6,450 |
| 22. | Turners Falls | 1.2% | 0.22%(+0.953)#22 | 0.61%(+0.563)#6,558 |
| 23. | New Bedford | 1.2% | 0.22%(+0.950)#23 | 0.61%(+0.560)#6,564 |
| 24. | West Yarmouth | 1.1% | 0.22%(+0.898)#24 | 0.61%(+0.508)#6,700 |
| 25. | West Dennis | 1.1% | 0.22%(+0.877)#25 | 0.61%(+0.487)#6,766 |
| 26. | Gloucester | 1.0% | 0.22%(+0.808)#26 | 0.61%(+0.418)#6,969 |
| 27. | Swampscott | 0.99% | 0.22%(+0.771)#27 | 0.61%(+0.380)#7,085 |
| 28. | Somerset | 0.91% | 0.22%(+0.692)#28 | 0.61%(+0.302)#7,314 |
| 29. | Upton | 0.90% | 0.22%(+0.687)#29 | 0.61%(+0.297)#7,329 |
| 30. | Athol | 0.87% | 0.22%(+0.654)#30 | 0.61%(+0.263)#7,457 |
| 31. | Rockport | 0.80% | 0.22%(+0.589)#31 | 0.61%(+0.199)#7,693 |
| 32. | Chelsea | 0.70% | 0.22%(+0.487)#32 | 0.61%(+0.097)#8,077 |
| 33. | North Falmouth | 0.64% | 0.22%(+0.428)#33 | 0.61%(+0.038)#8,314 |
| 34. | Holland | 0.64% | 0.22%(+0.427)#34 | 0.61%(+0.037)#8,318 |
| 35. | Ipswich | 0.64% | 0.22%(+0.423)#35 | 0.61%(+0.033)#8,339 |
| 36. | Leominster | 0.62% | 0.22%(+0.406)#36 | 0.61%(+0.016)#8,401 |
| 37. | Bliss Corner | 0.59% | 0.22%(+0.377)#37 | 0.61%(-0.013)#8,540 |
| 38. | Barnstable Town | 0.54% | 0.22%(+0.326)#38 | 0.61%(-0.064)#8,777 |
| 39. | West Springfield Town | 0.48% | 0.22%(+0.268)#39 | 0.61%(-0.122)#9,056 |
| 40. | Nahant | 0.48% | 0.22%(+0.262)#40 | 0.61%(-0.129)#9,105 |
| 41. | Haverhill | 0.48% | 0.22%(+0.260)#41 | 0.61%(-0.130)#9,116 |
| 42. | North Attleborough | 0.47% | 0.22%(+0.258)#42 | 0.61%(-0.132)#9,126 |
| 43. | Southbridge Town | 0.46% | 0.22%(+0.244)#43 | 0.61%(-0.147)#9,205 |
| 44. | Springfield | 0.44% | 0.22%(+0.225)#44 | 0.61%(-0.166)#9,332 |
| 45. | Hull | 0.44% | 0.22%(+0.221)#45 | 0.61%(-0.169)#9,355 |
| 46. | Maynard | 0.43% | 0.22%(+0.218)#46 | 0.61%(-0.172)#9,371 |
| 47. | Salisbury | 0.41% | 0.22%(+0.190)#47 | 0.61%(-0.200)#9,518 |
| 48. | Needham | 0.40% | 0.22%(+0.188)#48 | 0.61%(-0.202)#9,529 |
| 49. | Chicopee | 0.40% | 0.22%(+0.186)#49 | 0.61%(-0.204)#9,534 |
| 50. | Yarmouth Port | 0.40% | 0.22%(+0.180)#50 | 0.61%(-0.210)#9,575 |
| 51. | East Harwich | 0.39% | 0.22%(+0.170)#51 | 0.61%(-0.220)#9,638 |
| 52. | Franklin Town | 0.38% | 0.22%(+0.168)#52 | 0.61%(-0.222)#9,652 |
| 53. | Danvers | 0.34% | 0.22%(+0.121)#53 | 0.61%(-0.270)#9,945 |
| 54. | Cochituate | 0.32% | 0.22%(+0.104)#54 | 0.61%(-0.286)#10,041 |
| 55. | Arlington | 0.32% | 0.22%(+0.103)#55 | 0.61%(-0.287)#10,047 |
| 56. | Fitchburg | 0.31% | 0.22%(+0.093)#56 | 0.61%(-0.297)#10,104 |
| 57. | Attleboro | 0.27% | 0.22%(+0.051)#57 | 0.61%(-0.340)#10,355 |
| 58. | Taunton | 0.25% | 0.22%(+0.039)#58 | 0.61%(-0.351)#10,434 |
| 59. | Braintree Town | 0.25% | 0.22%(+0.037)#59 | 0.61%(-0.353)#10,444 |
| 60. | Pittsfield | 0.25% | 0.22%(+0.030)#60 | 0.61%(-0.360)#10,483 |
| 61. | Easthampton Town | 0.23% | 0.22%(+0.020)#61 | 0.61%(-0.371)#10,554 |
| 62. | Revere | 0.22% | 0.22%(+0.003)#62 | 0.61%(-0.387)#10,679 |
| 63. | Newburyport | 0.21% | 0.22%(-0.004)#63 | 0.61%(-0.394)#10,719 |
| 64. | Agawam Town | 0.21% | 0.22%(-0.005)#64 | 0.61%(-0.395)#10,725 |
| 65. | Medford | 0.21% | 0.22%(-0.007)#65 | 0.61%(-0.397)#10,736 |
| 66. | Northampton | 0.19% | 0.22%(-0.027)#66 | 0.61%(-0.417)#10,849 |
| 67. | Marblehead | 0.18% | 0.22%(-0.039)#67 | 0.61%(-0.429)#10,936 |
| 68. | Bridgewater Town | 0.17% | 0.22%(-0.045)#68 | 0.61%(-0.435)#10,978 |
| 69. | North Scituate | 0.17% | 0.22%(-0.048)#69 | 0.61%(-0.438)#11,000 |
| 70. | Wilmington | 0.16% | 0.22%(-0.052)#70 | 0.61%(-0.442)#11,028 |
| 71. | Brockton | 0.16% | 0.22%(-0.054)#71 | 0.61%(-0.445)#11,046 |
| 72. | Winchester | 0.16% | 0.22%(-0.057)#72 | 0.61%(-0.447)#11,068 |
| 73. | Lawrence | 0.16% | 0.22%(-0.060)#73 | 0.61%(-0.450)#11,089 |
| 74. | Westfield | 0.14% | 0.22%(-0.075)#74 | 0.61%(-0.465)#11,191 |
| 75. | Dedham | 0.14% | 0.22%(-0.075)#75 | 0.61%(-0.466)#11,193 |
| 76. | Fall River | 0.14% | 0.22%(-0.077)#76 | 0.61%(-0.467)#11,212 |
| 77. | Gardner | 0.14% | 0.22%(-0.079)#77 | 0.61%(-0.469)#11,217 |
| 78. | Lexington | 0.13% | 0.22%(-0.081)#78 | 0.61%(-0.471)#11,238 |
| 79. | Worcester | 0.11% | 0.22%(-0.101)#79 | 0.61%(-0.491)#11,380 |
| 80. | Framingham | 0.11% | 0.22%(-0.103)#80 | 0.61%(-0.493)#11,389 |
| 81. | Weymouth Town | 0.10% | 0.22%(-0.110)#81 | 0.61%(-0.501)#11,444 |
| 82. | Amherst | 0.097% | 0.22%(-0.118)#82 | 0.61%(-0.508)#11,508 |
| 83. | Lowell | 0.090% | 0.22%(-0.126)#83 | 0.61%(-0.516)#11,557 |
| 84. | Marlborough | 0.074% | 0.22%(-0.141)#84 | 0.61%(-0.531)#11,655 |
| 85. | Quincy | 0.071% | 0.22%(-0.144)#85 | 0.61%(-0.534)#11,676 |
| 86. | Cambridge | 0.071% | 0.22%(-0.145)#86 | 0.61%(-0.535)#11,683 |
| 87. | Lynn | 0.068% | 0.22%(-0.148)#87 | 0.61%(-0.538)#11,699 |
| 88. | Boston | 0.067% | 0.22%(-0.148)#88 | 0.61%(-0.538)#11,701 |
| 89. | Norwood | 0.061% | 0.22%(-0.154)#89 | 0.61%(-0.544)#11,751 |
| 90. | Holyoke | 0.058% | 0.22%(-0.157)#90 | 0.61%(-0.547)#11,774 |
| 91. | Newton | 0.052% | 0.22%(-0.163)#91 | 0.61%(-0.553)#11,810 |
| 92. | Beverly | 0.052% | 0.22%(-0.164)#92 | 0.61%(-0.554)#11,812 |
| 93. | Salem | 0.051% | 0.22%(-0.165)#93 | 0.61%(-0.555)#11,820 |
| 94. | Waltham | 0.047% | 0.22%(-0.168)#94 | 0.61%(-0.558)#11,840 |
| 95. | Woburn | 0.039% | 0.22%(-0.176)#95 | 0.61%(-0.567)#11,898 |
| 96. | Everett | 0.038% | 0.22%(-0.178)#96 | 0.61%(-0.568)#11,908 |
| 97. | Ware | 0.037% | 0.22%(-0.179)#97 | 0.61%(-0.569)#11,918 |
| 98. | Methuen Town | 0.025% | 0.22%(-0.190)#98 | 0.61%(-0.580)#11,974 |
Common Questions
What are the Top 10 Cities with the Highest Percentage of Population Employed in Farming, Fishing & Forestry in Massachusetts?
Top 10 Cities with the Highest Percentage of Population Employed in Farming, Fishing & Forestry in Massachusetts are:
#1
10.0%
#2
4.3%
#3
3.6%
#4
3.1%
#5
3.0%
#6
2.8%
#7
2.6%
#8
2.6%
#9
2.1%
#10
2.0%
What city has the Highest Percentage of Population Employed in Farming, Fishing & Forestry in Massachusetts?
North Eastham has the Highest Percentage of Population Employed in Farming, Fishing & Forestry in Massachusetts with 10.0%.
What is the Percentage of Population Employed in Farming, Fishing & Forestry in the State of Massachusetts?
Percentage of Population Employed in Farming, Fishing & Forestry in Massachusetts is 0.22%.
What is the Percentage of Population Employed in Farming, Fishing & Forestry in the United States?
Percentage of Population Employed in Farming, Fishing & Forestry in the United States is 0.61%.