Cities with the Highest Percentage of Population Employed in Farming, Fishing & Forestry in Michigan
RELATED REPORTS & OPTIONS
Farming, Fishing & Forestry
Michigan
Compare Cities
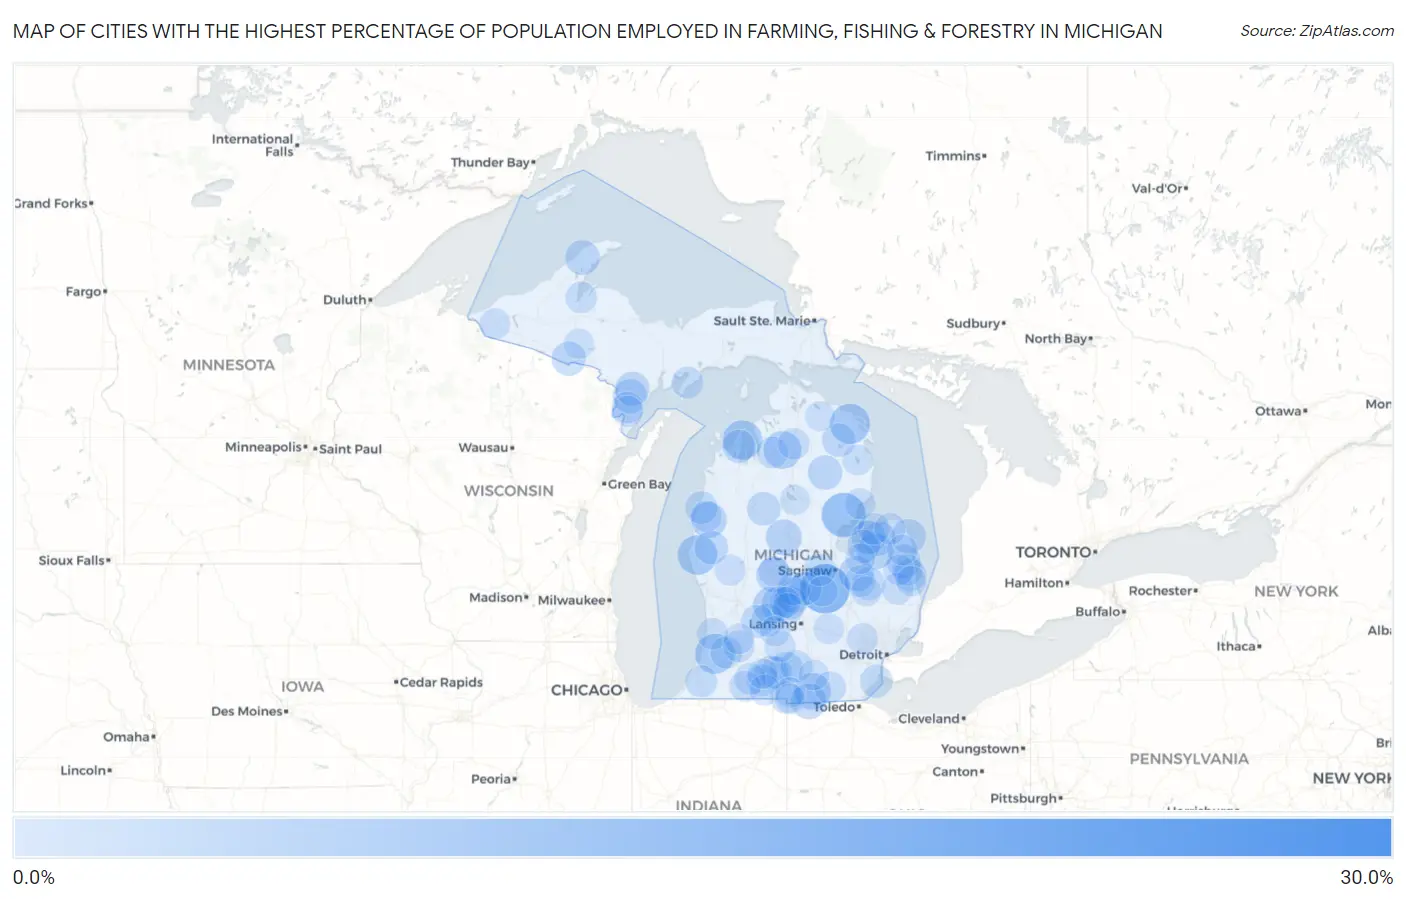
Map of Cities with the Highest Percentage of Population Employed in Farming, Fishing & Forestry in Michigan
0.0%
30.0%
Cities with the Highest Percentage of Population Employed in Farming, Fishing & Forestry in Michigan
| City | % Employed | vs State | vs National | |
| 1. | Falmouth | 26.7% | 0.47%(+26.3)#1 | 0.61%(+26.1)#285 |
| 2. | Chesaning | 14.4% | 0.47%(+14.0)#2 | 0.61%(+13.8)#668 |
| 3. | Twining | 11.0% | 0.47%(+10.5)#3 | 0.61%(+10.4)#961 |
| 4. | Skanee | 10.3% | 0.47%(+9.79)#4 | 0.61%(+9.65)#1,042 |
| 5. | Painesdale | 9.0% | 0.47%(+8.56)#5 | 0.61%(+8.42)#1,224 |
| 6. | Posen | 8.2% | 0.47%(+7.77)#6 | 0.61%(+7.63)#1,377 |
| 7. | Breedsville | 8.1% | 0.47%(+7.64)#7 | 0.61%(+7.50)#1,401 |
| 8. | Shelby | 7.8% | 0.47%(+7.38)#8 | 0.61%(+7.24)#1,465 |
| 9. | Omena | 7.7% | 0.47%(+7.23)#9 | 0.61%(+7.09)#1,493 |
| 10. | Lakes Of The North | 6.7% | 0.47%(+6.18)#10 | 0.61%(+6.04)#1,753 |
| 11. | Elm Hall | 6.6% | 0.47%(+6.09)#11 | 0.61%(+5.95)#1,769 |
| 12. | Gagetown | 5.9% | 0.47%(+5.42)#12 | 0.61%(+5.28)#1,960 |
| 13. | Hudson | 5.8% | 0.47%(+5.36)#13 | 0.61%(+5.22)#1,980 |
| 14. | Ionia | 5.7% | 0.47%(+5.28)#14 | 0.61%(+5.14)#2,010 |
| 15. | Farwell | 5.5% | 0.47%(+5.00)#15 | 0.61%(+4.86)#2,112 |
| 16. | Fountain | 5.4% | 0.47%(+4.94)#16 | 0.61%(+4.80)#2,145 |
| 17. | Waldron | 5.3% | 0.47%(+4.82)#17 | 0.61%(+4.68)#2,192 |
| 18. | Maple Rapids | 5.0% | 0.47%(+4.52)#18 | 0.61%(+4.38)#2,315 |
| 19. | Mcbride | 4.9% | 0.47%(+4.47)#19 | 0.61%(+4.33)#2,329 |
| 20. | Vassar | 4.9% | 0.47%(+4.44)#20 | 0.61%(+4.30)#2,344 |
| 21. | Lyons | 4.8% | 0.47%(+4.38)#21 | 0.61%(+4.24)#2,371 |
| 22. | Copper City | 4.6% | 0.47%(+4.15)#22 | 0.61%(+4.01)#2,480 |
| 23. | Palo | 4.6% | 0.47%(+4.14)#23 | 0.61%(+4.00)#2,483 |
| 24. | Harbor Beach | 4.5% | 0.47%(+4.05)#24 | 0.61%(+3.91)#2,535 |
| 25. | Mio | 4.5% | 0.47%(+3.99)#25 | 0.61%(+3.85)#2,569 |
| 26. | Elkton | 4.4% | 0.47%(+3.91)#26 | 0.61%(+3.77)#2,602 |
| 27. | Carney | 4.3% | 0.47%(+3.88)#27 | 0.61%(+3.74)#2,622 |
| 28. | Powers | 4.3% | 0.47%(+3.83)#28 | 0.61%(+3.70)#2,648 |
| 29. | Caspian | 4.3% | 0.47%(+3.81)#29 | 0.61%(+3.67)#2,661 |
| 30. | Deckerville | 4.3% | 0.47%(+3.79)#30 | 0.61%(+3.65)#2,669 |
| 31. | Bay Port | 4.2% | 0.47%(+3.77)#31 | 0.61%(+3.63)#2,678 |
| 32. | Burlington | 4.0% | 0.47%(+3.57)#32 | 0.61%(+3.43)#2,797 |
| 33. | Walkerville | 4.0% | 0.47%(+3.53)#33 | 0.61%(+3.39)#2,820 |
| 34. | Hillman | 4.0% | 0.47%(+3.52)#34 | 0.61%(+3.38)#2,831 |
| 35. | Mcbain | 4.0% | 0.47%(+3.50)#35 | 0.61%(+3.36)#2,844 |
| 36. | Greenland | 3.9% | 0.47%(+3.48)#36 | 0.61%(+3.34)#2,864 |
| 37. | Homer | 3.9% | 0.47%(+3.40)#37 | 0.61%(+3.26)#2,922 |
| 38. | Fowler | 3.8% | 0.47%(+3.31)#38 | 0.61%(+3.17)#2,976 |
| 39. | Ashley | 3.7% | 0.47%(+3.27)#39 | 0.61%(+3.13)#3,009 |
| 40. | Suttons Bay | 3.7% | 0.47%(+3.20)#40 | 0.61%(+3.06)#3,061 |
| 41. | Sebewaing | 3.6% | 0.47%(+3.18)#41 | 0.61%(+3.04)#3,079 |
| 42. | Perrinton | 3.6% | 0.47%(+3.16)#42 | 0.61%(+3.02)#3,102 |
| 43. | Fostoria | 3.6% | 0.47%(+3.12)#43 | 0.61%(+2.98)#3,135 |
| 44. | Freeport | 3.5% | 0.47%(+3.07)#44 | 0.61%(+2.93)#3,188 |
| 45. | Estral Beach | 3.5% | 0.47%(+3.07)#45 | 0.61%(+2.93)#3,192 |
| 46. | Lake Odessa | 3.5% | 0.47%(+3.05)#46 | 0.61%(+2.91)#3,201 |
| 47. | Applegate | 3.5% | 0.47%(+3.01)#47 | 0.61%(+2.87)#3,233 |
| 48. | Oak Hill | 3.2% | 0.47%(+2.77)#48 | 0.61%(+2.63)#3,424 |
| 49. | Tekonsha | 3.1% | 0.47%(+2.64)#49 | 0.61%(+2.50)#3,551 |
| 50. | Concord | 3.0% | 0.47%(+2.57)#50 | 0.61%(+2.43)#3,605 |
| 51. | Gobles | 3.0% | 0.47%(+2.53)#51 | 0.61%(+2.39)#3,645 |
| 52. | Hemlock | 3.0% | 0.47%(+2.52)#52 | 0.61%(+2.38)#3,652 |
| 53. | Montgomery | 3.0% | 0.47%(+2.52)#53 | 0.61%(+2.38)#3,655 |
| 54. | Sherwood | 3.0% | 0.47%(+2.50)#54 | 0.61%(+2.36)#3,677 |
| 55. | Eau Claire | 2.9% | 0.47%(+2.44)#55 | 0.61%(+2.30)#3,735 |
| 56. | Garden | 2.9% | 0.47%(+2.39)#56 | 0.61%(+2.25)#3,786 |
| 57. | Adrian | 2.8% | 0.47%(+2.35)#57 | 0.61%(+2.22)#3,831 |
| 58. | Mendon | 2.8% | 0.47%(+2.29)#58 | 0.61%(+2.15)#3,888 |
| 59. | Mancelona | 2.7% | 0.47%(+2.28)#59 | 0.61%(+2.14)#3,905 |
| 60. | Plainwell | 2.7% | 0.47%(+2.27)#60 | 0.61%(+2.13)#3,916 |
| 61. | Caseville | 2.7% | 0.47%(+2.23)#61 | 0.61%(+2.09)#3,972 |
| 62. | Zeba | 2.7% | 0.47%(+2.21)#62 | 0.61%(+2.07)#3,989 |
| 63. | Gaylord | 2.7% | 0.47%(+2.19)#63 | 0.61%(+2.05)#4,012 |
| 64. | Melvin | 2.6% | 0.47%(+2.17)#64 | 0.61%(+2.03)#4,042 |
| 65. | Daggett | 2.6% | 0.47%(+2.13)#65 | 0.61%(+1.99)#4,081 |
| 66. | Millington | 2.6% | 0.47%(+2.09)#66 | 0.61%(+1.95)#4,130 |
| 67. | Kinde | 2.5% | 0.47%(+2.07)#67 | 0.61%(+1.93)#4,163 |
| 68. | Fennville | 2.5% | 0.47%(+2.02)#68 | 0.61%(+1.89)#4,227 |
| 69. | Centreville | 2.5% | 0.47%(+2.01)#69 | 0.61%(+1.87)#4,242 |
| 70. | Crystal | 2.5% | 0.47%(+2.01)#70 | 0.61%(+1.87)#4,244 |
| 71. | Westphalia | 2.4% | 0.47%(+1.95)#71 | 0.61%(+1.81)#4,298 |
| 72. | Olivet | 2.4% | 0.47%(+1.91)#72 | 0.61%(+1.78)#4,337 |
| 73. | Pewamo | 2.4% | 0.47%(+1.91)#73 | 0.61%(+1.78)#4,341 |
| 74. | Free Soil | 2.4% | 0.47%(+1.91)#74 | 0.61%(+1.78)#4,354 |
| 75. | Newaygo | 2.4% | 0.47%(+1.89)#75 | 0.61%(+1.75)#4,370 |
| 76. | Stephenson | 2.3% | 0.47%(+1.83)#76 | 0.61%(+1.69)#4,448 |
| 77. | Carsonville | 2.3% | 0.47%(+1.81)#77 | 0.61%(+1.67)#4,470 |
| 78. | Bronson | 2.3% | 0.47%(+1.79)#78 | 0.61%(+1.65)#4,489 |
| 79. | Sandusky | 2.2% | 0.47%(+1.78)#79 | 0.61%(+1.64)#4,504 |
| 80. | Tawas City | 2.2% | 0.47%(+1.77)#80 | 0.61%(+1.64)#4,519 |
| 81. | Walled Lake | 2.2% | 0.47%(+1.72)#81 | 0.61%(+1.59)#4,581 |
| 82. | Wakefield | 2.1% | 0.47%(+1.67)#82 | 0.61%(+1.53)#4,660 |
| 83. | Minden City | 2.1% | 0.47%(+1.62)#83 | 0.61%(+1.48)#4,735 |
| 84. | Martin | 2.0% | 0.47%(+1.58)#84 | 0.61%(+1.44)#4,787 |
| 85. | Covington | 2.0% | 0.47%(+1.57)#85 | 0.61%(+1.44)#4,815 |
| 86. | Fowlerville | 2.0% | 0.47%(+1.56)#86 | 0.61%(+1.42)#4,832 |
| 87. | Edmore | 2.0% | 0.47%(+1.54)#87 | 0.61%(+1.41)#4,856 |
| 88. | Cement City | 2.0% | 0.47%(+1.54)#88 | 0.61%(+1.40)#4,859 |
| 89. | Hubbard Lake | 2.0% | 0.47%(+1.52)#89 | 0.61%(+1.38)#4,887 |
| 90. | Prudenville | 1.9% | 0.47%(+1.48)#90 | 0.61%(+1.34)#4,952 |
| 91. | Vermontville | 1.9% | 0.47%(+1.39)#91 | 0.61%(+1.25)#5,113 |
| 92. | Amasa | 1.9% | 0.47%(+1.39)#92 | 0.61%(+1.25)#5,118 |
| 93. | Reading | 1.8% | 0.47%(+1.35)#93 | 0.61%(+1.21)#5,166 |
| 94. | Croswell | 1.8% | 0.47%(+1.33)#94 | 0.61%(+1.19)#5,198 |
| 95. | Athens | 1.8% | 0.47%(+1.31)#95 | 0.61%(+1.17)#5,224 |
| 96. | Akron | 1.8% | 0.47%(+1.31)#96 | 0.61%(+1.17)#5,231 |
| 97. | Columbiaville | 1.8% | 0.47%(+1.30)#97 | 0.61%(+1.16)#5,239 |
| 98. | Oakley | 1.8% | 0.47%(+1.30)#98 | 0.61%(+1.16)#5,242 |
| 99. | Onaway | 1.8% | 0.47%(+1.30)#99 | 0.61%(+1.16)#5,246 |
| 100. | Camden | 1.8% | 0.47%(+1.30)#100 | 0.61%(+1.16)#5,247 |
Common Questions
What are the Top 10 Cities with the Highest Percentage of Population Employed in Farming, Fishing & Forestry in Michigan?
Top 10 Cities with the Highest Percentage of Population Employed in Farming, Fishing & Forestry in Michigan are:
#1
14.4%
#2
11.0%
#3
8.2%
#4
8.1%
#5
7.8%
#6
7.7%
#7
6.7%
#8
5.9%
#9
5.8%
#10
5.7%
What city has the Highest Percentage of Population Employed in Farming, Fishing & Forestry in Michigan?
Chesaning has the Highest Percentage of Population Employed in Farming, Fishing & Forestry in Michigan with 14.4%.
What is the Percentage of Population Employed in Farming, Fishing & Forestry in the State of Michigan?
Percentage of Population Employed in Farming, Fishing & Forestry in Michigan is 0.47%.
What is the Percentage of Population Employed in Farming, Fishing & Forestry in the United States?
Percentage of Population Employed in Farming, Fishing & Forestry in the United States is 0.61%.