Zip Codes with the Highest Percentage of Population Employed in Farming, Fishing & Forestry in Buena Park, CA
RELATED REPORTS & OPTIONS
Farming, Fishing & Forestry
Buena Park
Compare Zip Codes
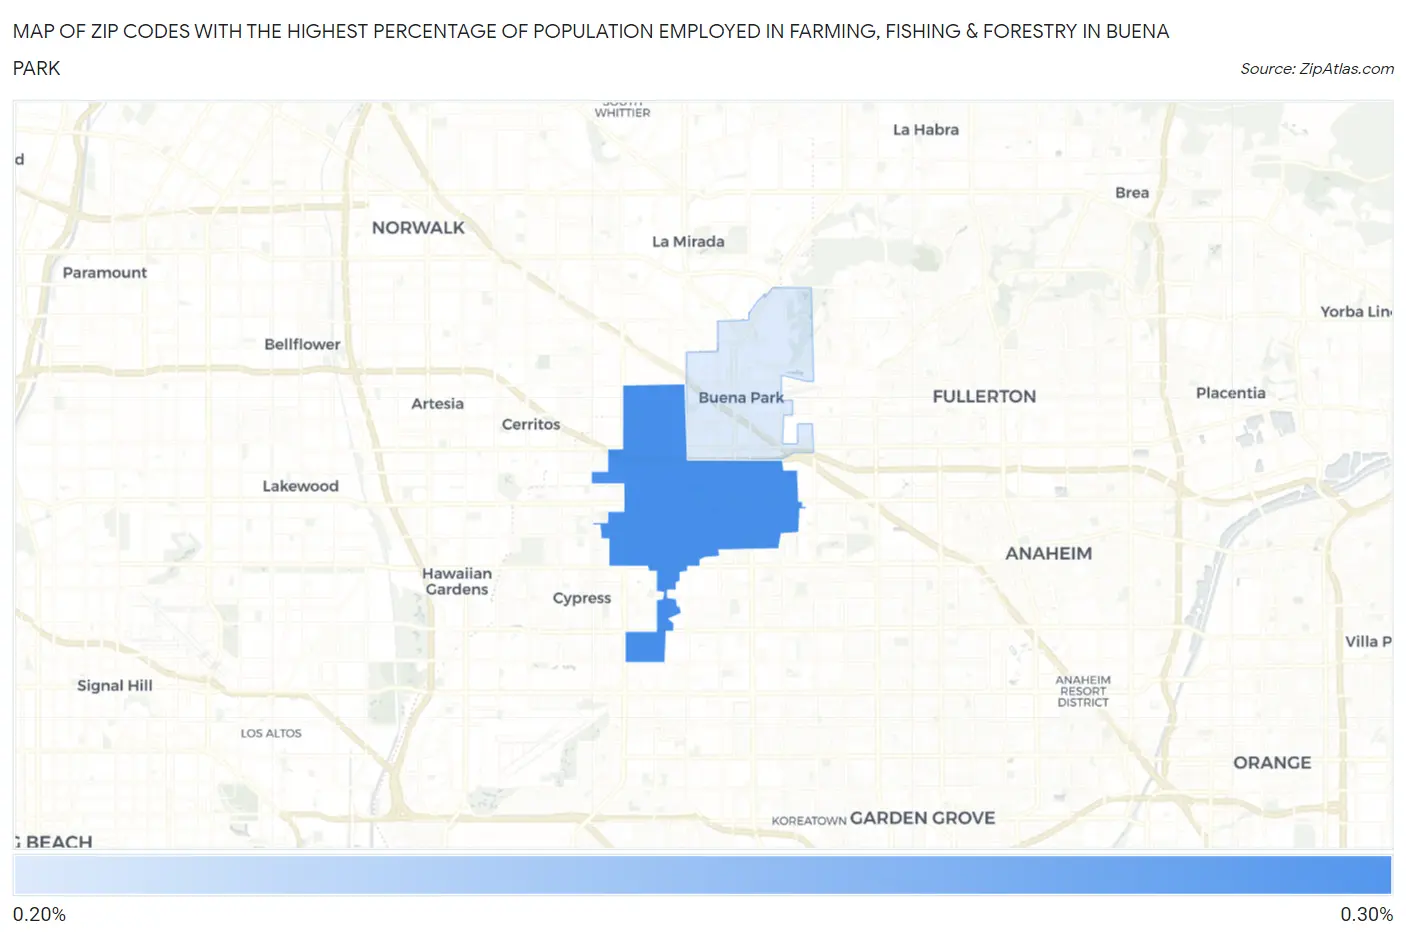
Map of Zip Codes with the Highest Percentage of Population Employed in Farming, Fishing & Forestry in Buena Park
0.27%
0.29%
Zip Codes with the Highest Percentage of Population Employed in Farming, Fishing & Forestry in Buena Park, CA
| Zip Code | % Employed | vs State | vs National | |
| 1. | 90620 | 0.29% | 1.4%(-1.12)#857 | 0.61%(-0.319)#14,980 |
| 2. | 90621 | 0.27% | 1.4%(-1.14)#868 | 0.61%(-0.331)#15,120 |
1
Common Questions
What are the Top Zip Codes with the Highest Percentage of Population Employed in Farming, Fishing & Forestry in Buena Park, CA?
Top Zip Codes with the Highest Percentage of Population Employed in Farming, Fishing & Forestry in Buena Park, CA are:
What zip code has the Highest Percentage of Population Employed in Farming, Fishing & Forestry in Buena Park, CA?
90620 has the Highest Percentage of Population Employed in Farming, Fishing & Forestry in Buena Park, CA with 0.29%.
What is the Percentage of Population Employed in Farming, Fishing & Forestry in Buena Park, CA?
Percentage of Population Employed in Farming, Fishing & Forestry in Buena Park is 0.28%.
What is the Percentage of Population Employed in Farming, Fishing & Forestry in California?
Percentage of Population Employed in Farming, Fishing & Forestry in California is 1.4%.
What is the Percentage of Population Employed in Farming, Fishing & Forestry in the United States?
Percentage of Population Employed in Farming, Fishing & Forestry in the United States is 0.61%.