Cities with the Highest Percentage of Population Employed in Farming, Fishing & Forestry in Pennsylvania
RELATED REPORTS & OPTIONS
Farming, Fishing & Forestry
Pennsylvania
Compare Cities
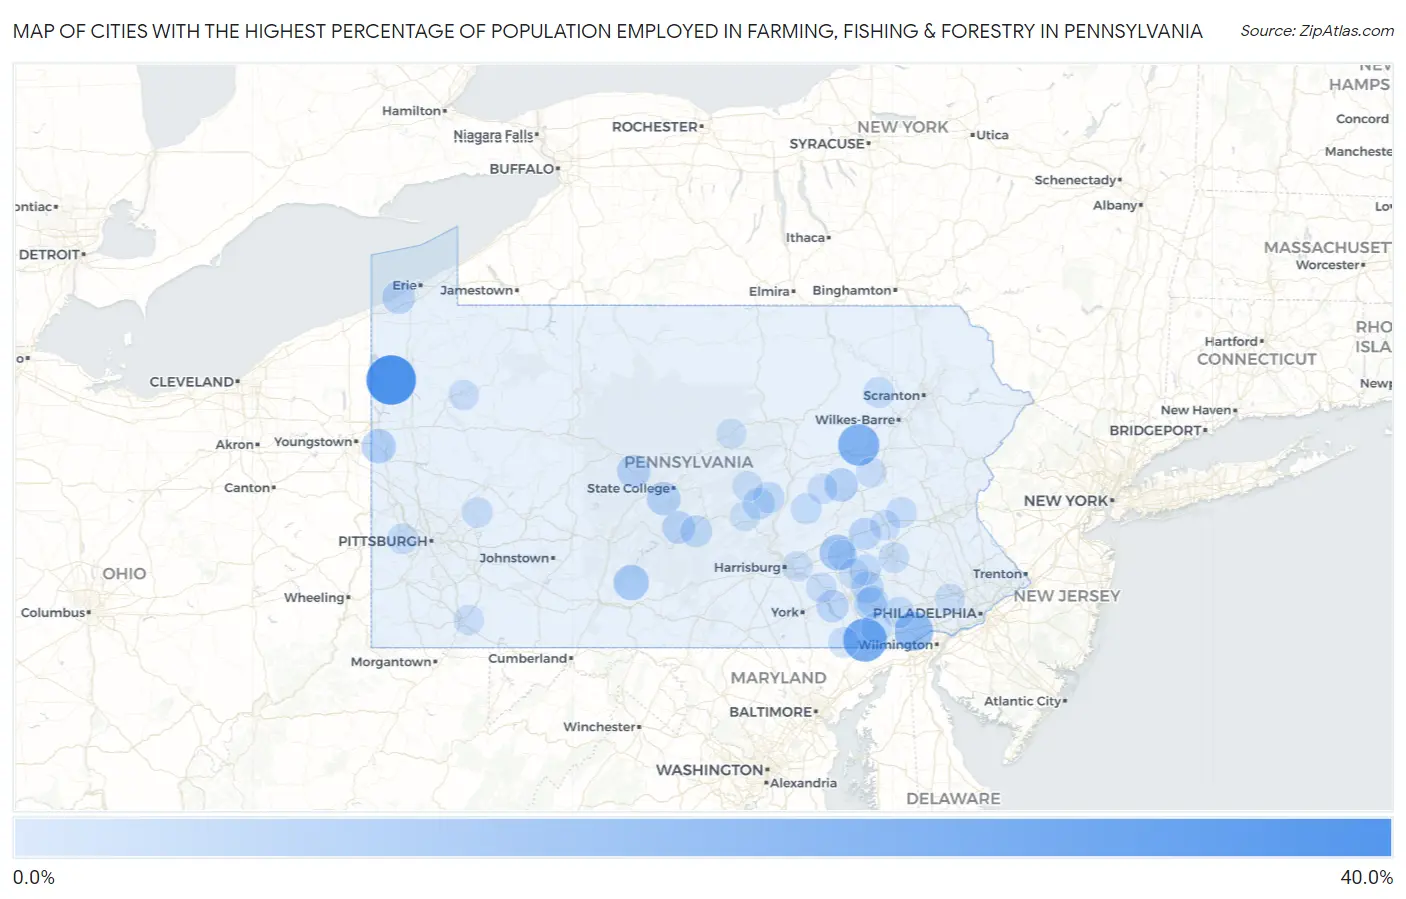
Map of Cities with the Highest Percentage of Population Employed in Farming, Fishing & Forestry in Pennsylvania
0.0%
40.0%
Cities with the Highest Percentage of Population Employed in Farming, Fishing & Forestry in Pennsylvania
| City | % Employed | vs State | vs National | |
| 1. | Atlantic | 37.5% | 0.41%(+37.1)#1 | 0.61%(+36.9)#142 |
| 2. | Clappertown | 32.0% | 0.41%(+31.6)#2 | 0.61%(+31.4)#191 |
| 3. | Wakefield | 26.3% | 0.41%(+25.9)#3 | 0.61%(+25.7)#294 |
| 4. | Avondale Borough | 26.0% | 0.41%(+25.6)#4 | 0.61%(+25.4)#301 |
| 5. | Foundryville | 22.2% | 0.41%(+21.8)#5 | 0.61%(+21.6)#377 |
| 6. | Curryville | 20.0% | 0.41%(+19.6)#6 | 0.61%(+19.4)#445 |
| 7. | Toughkenamon | 17.9% | 0.41%(+17.5)#7 | 0.61%(+17.3)#518 |
| 8. | New Columbus Borough | 15.9% | 0.41%(+15.5)#8 | 0.61%(+15.3)#596 |
| 9. | Sand Hill | 12.4% | 0.41%(+12.0)#9 | 0.61%(+11.8)#834 |
| 10. | York Springs Borough | 12.0% | 0.41%(+11.6)#10 | 0.61%(+11.4)#872 |
| 11. | Defiance | 11.3% | 0.41%(+10.9)#11 | 0.61%(+10.7)#918 |
| 12. | Saltillo Borough | 11.0% | 0.41%(+10.6)#12 | 0.61%(+10.4)#959 |
| 13. | Kennett Square Borough | 9.5% | 0.41%(+9.10)#13 | 0.61%(+8.90)#1,151 |
| 14. | Frizzleburg | 9.3% | 0.41%(+8.92)#14 | 0.61%(+8.72)#1,177 |
| 15. | Larke | 8.3% | 0.41%(+7.93)#15 | 0.61%(+7.73)#1,360 |
| 16. | Wilburton Number One | 8.2% | 0.41%(+7.82)#16 | 0.61%(+7.62)#1,378 |
| 17. | Ramblewood | 8.2% | 0.41%(+7.75)#17 | 0.61%(+7.55)#1,393 |
| 18. | Sylvania Borough | 8.0% | 0.41%(+7.64)#18 | 0.61%(+7.44)#1,421 |
| 19. | North Philipsburg | 7.6% | 0.41%(+7.24)#19 | 0.61%(+7.04)#1,516 |
| 20. | Avonia | 7.1% | 0.41%(+6.65)#20 | 0.61%(+6.45)#1,650 |
| 21. | Cochranton Borough | 6.9% | 0.41%(+6.49)#21 | 0.61%(+6.29)#1,690 |
| 22. | Allensville | 6.7% | 0.41%(+6.30)#22 | 0.61%(+6.10)#1,727 |
| 23. | Port Royal Borough | 6.4% | 0.41%(+6.01)#23 | 0.61%(+5.81)#1,804 |
| 24. | East Sharpsburg | 6.3% | 0.41%(+5.92)#24 | 0.61%(+5.72)#1,831 |
| 25. | Washington Boro | 5.9% | 0.41%(+5.49)#25 | 0.61%(+5.29)#1,956 |
| 26. | Shellytown | 5.9% | 0.41%(+5.48)#26 | 0.61%(+5.28)#1,965 |
| 27. | Gordonville | 5.8% | 0.41%(+5.36)#27 | 0.61%(+5.16)#2,004 |
| 28. | Farmersville | 5.6% | 0.41%(+5.18)#28 | 0.61%(+4.98)#2,056 |
| 29. | Strausstown | 5.6% | 0.41%(+5.15)#29 | 0.61%(+4.95)#2,071 |
| 30. | North Bend | 5.4% | 0.41%(+5.00)#30 | 0.61%(+4.80)#2,143 |
| 31. | Longfellow | 5.4% | 0.41%(+5.00)#31 | 0.61%(+4.80)#2,149 |
| 32. | Bloomfield Borough | 5.3% | 0.41%(+4.92)#32 | 0.61%(+4.72)#2,176 |
| 33. | Gratz Borough | 5.3% | 0.41%(+4.90)#33 | 0.61%(+4.70)#2,184 |
| 34. | Westfield Borough | 5.2% | 0.41%(+4.80)#34 | 0.61%(+4.60)#2,221 |
| 35. | Richfield | 5.0% | 0.41%(+4.59)#35 | 0.61%(+4.39)#2,301 |
| 36. | Intercourse | 4.7% | 0.41%(+4.25)#36 | 0.61%(+4.05)#2,460 |
| 37. | Linesville Borough | 4.6% | 0.41%(+4.20)#37 | 0.61%(+4.00)#2,484 |
| 38. | Fairchance Borough | 4.5% | 0.41%(+4.12)#38 | 0.61%(+3.92)#2,529 |
| 39. | Mount Pleasant Mills | 4.5% | 0.41%(+4.05)#39 | 0.61%(+3.85)#2,564 |
| 40. | Schoeneck | 4.4% | 0.41%(+4.01)#40 | 0.61%(+3.81)#2,584 |
| 41. | Pomeroy | 4.3% | 0.41%(+3.90)#41 | 0.61%(+3.70)#2,647 |
| 42. | Atwood Borough | 4.2% | 0.41%(+3.76)#42 | 0.61%(+3.56)#2,725 |
| 43. | Oswayo Borough | 4.0% | 0.41%(+3.59)#43 | 0.61%(+3.39)#2,823 |
| 44. | New Paris Borough | 4.0% | 0.41%(+3.56)#44 | 0.61%(+3.36)#2,840 |
| 45. | Wellsville Borough | 4.0% | 0.41%(+3.56)#45 | 0.61%(+3.36)#2,841 |
| 46. | Noxen | 3.9% | 0.41%(+3.52)#46 | 0.61%(+3.32)#2,876 |
| 47. | Klingerstown | 3.9% | 0.41%(+3.52)#47 | 0.61%(+3.32)#2,889 |
| 48. | Kirkwood | 3.8% | 0.41%(+3.44)#48 | 0.61%(+3.24)#2,931 |
| 49. | Skelp | 3.8% | 0.41%(+3.39)#49 | 0.61%(+3.19)#2,968 |
| 50. | Newburg Borough Cumberland County | 3.8% | 0.41%(+3.38)#50 | 0.61%(+3.18)#2,973 |
| 51. | Chicora Borough | 3.8% | 0.41%(+3.35)#51 | 0.61%(+3.15)#2,992 |
| 52. | Millbourne Borough | 3.7% | 0.41%(+3.31)#52 | 0.61%(+3.11)#3,025 |
| 53. | Rome Borough | 3.7% | 0.41%(+3.26)#53 | 0.61%(+3.06)#3,063 |
| 54. | Imperial | 3.6% | 0.41%(+3.22)#54 | 0.61%(+3.02)#3,107 |
| 55. | Susquehanna Trails | 3.6% | 0.41%(+3.20)#55 | 0.61%(+3.00)#3,127 |
| 56. | West Grove Borough | 3.6% | 0.41%(+3.17)#56 | 0.61%(+2.98)#3,139 |
| 57. | Kempton | 3.6% | 0.41%(+3.17)#57 | 0.61%(+2.97)#3,155 |
| 58. | Berrysburg Borough | 3.5% | 0.41%(+3.12)#58 | 0.61%(+2.92)#3,200 |
| 59. | Eldred Borough | 3.5% | 0.41%(+3.07)#59 | 0.61%(+2.87)#3,231 |
| 60. | Clark Borough | 3.5% | 0.41%(+3.06)#60 | 0.61%(+2.86)#3,239 |
| 61. | Modena Borough | 3.4% | 0.41%(+3.04)#61 | 0.61%(+2.84)#3,248 |
| 62. | Reading | 3.4% | 0.41%(+3.01)#62 | 0.61%(+2.81)#3,278 |
| 63. | Blain Borough | 3.3% | 0.41%(+2.90)#63 | 0.61%(+2.70)#3,365 |
| 64. | Starrucca Borough | 3.3% | 0.41%(+2.89)#64 | 0.61%(+2.69)#3,376 |
| 65. | Quakertown Borough | 3.3% | 0.41%(+2.88)#65 | 0.61%(+2.68)#3,383 |
| 66. | Saegertown Borough | 3.3% | 0.41%(+2.86)#66 | 0.61%(+2.66)#3,403 |
| 67. | Snow Shoe Borough | 3.2% | 0.41%(+2.82)#67 | 0.61%(+2.62)#3,434 |
| 68. | Hyde Park | 3.2% | 0.41%(+2.80)#68 | 0.61%(+2.60)#3,456 |
| 69. | Seward Borough | 3.2% | 0.41%(+2.76)#69 | 0.61%(+2.56)#3,488 |
| 70. | Hartleton Borough | 3.1% | 0.41%(+2.65)#70 | 0.61%(+2.45)#3,595 |
| 71. | Bethany Borough | 3.0% | 0.41%(+2.62)#71 | 0.61%(+2.42)#3,613 |
| 72. | Rutherford | 3.0% | 0.41%(+2.59)#72 | 0.61%(+2.39)#3,649 |
| 73. | Shamokin | 3.0% | 0.41%(+2.54)#73 | 0.61%(+2.35)#3,687 |
| 74. | Lemont Furnace | 2.9% | 0.41%(+2.54)#74 | 0.61%(+2.34)#3,690 |
| 75. | Robeson Extension | 2.9% | 0.41%(+2.54)#75 | 0.61%(+2.34)#3,698 |
| 76. | Smithton Borough | 2.8% | 0.41%(+2.41)#76 | 0.61%(+2.21)#3,834 |
| 77. | Darlington Borough | 2.8% | 0.41%(+2.37)#77 | 0.61%(+2.17)#3,868 |
| 78. | Woodland Heights | 2.8% | 0.41%(+2.36)#78 | 0.61%(+2.16)#3,880 |
| 79. | Troxelville | 2.7% | 0.41%(+2.34)#79 | 0.61%(+2.14)#3,899 |
| 80. | Rheems | 2.7% | 0.41%(+2.34)#80 | 0.61%(+2.14)#3,906 |
| 81. | Devon | 2.7% | 0.41%(+2.33)#81 | 0.61%(+2.13)#3,909 |
| 82. | Port Matilda Borough | 2.7% | 0.41%(+2.32)#82 | 0.61%(+2.12)#3,936 |
| 83. | Clarion Borough | 2.7% | 0.41%(+2.29)#83 | 0.61%(+2.09)#3,970 |
| 84. | Catawissa Borough | 2.7% | 0.41%(+2.28)#84 | 0.61%(+2.08)#3,978 |
| 85. | Lansford Borough | 2.7% | 0.41%(+2.28)#85 | 0.61%(+2.08)#3,983 |
| 86. | Conyngham Borough | 2.7% | 0.41%(+2.25)#86 | 0.61%(+2.05)#4,017 |
| 87. | Farwell | 2.6% | 0.41%(+2.21)#87 | 0.61%(+2.01)#4,058 |
| 88. | West Hamburg | 2.6% | 0.41%(+2.20)#88 | 0.61%(+2.00)#4,068 |
| 89. | Brickerville | 2.6% | 0.41%(+2.17)#89 | 0.61%(+1.97)#4,105 |
| 90. | Sheppton | 2.6% | 0.41%(+2.16)#90 | 0.61%(+1.96)#4,113 |
| 91. | Canton Borough | 2.6% | 0.41%(+2.15)#91 | 0.61%(+1.95)#4,132 |
| 92. | Shickshinny Borough | 2.5% | 0.41%(+2.12)#92 | 0.61%(+1.92)#4,176 |
| 93. | Mcconnellsburg Borough | 2.4% | 0.41%(+2.04)#93 | 0.61%(+1.84)#4,269 |
| 94. | Arendtsville Borough | 2.4% | 0.41%(+2.00)#94 | 0.61%(+1.80)#4,310 |
| 95. | Avon | 2.4% | 0.41%(+1.98)#95 | 0.61%(+1.78)#4,336 |
| 96. | East Salem | 2.4% | 0.41%(+1.95)#96 | 0.61%(+1.75)#4,384 |
| 97. | Nottingham | 2.3% | 0.41%(+1.92)#97 | 0.61%(+1.72)#4,428 |
| 98. | Mcelhattan | 2.3% | 0.41%(+1.87)#98 | 0.61%(+1.67)#4,466 |
| 99. | Brownstown Borough | 2.2% | 0.41%(+1.84)#99 | 0.61%(+1.64)#4,508 |
| 100. | Confluence Borough | 2.2% | 0.41%(+1.82)#100 | 0.61%(+1.62)#4,530 |
Common Questions
What are the Top 10 Cities with the Highest Percentage of Population Employed in Farming, Fishing & Forestry in Pennsylvania?
Top 10 Cities with the Highest Percentage of Population Employed in Farming, Fishing & Forestry in Pennsylvania are:
#1
37.5%
#2
26.3%
#3
22.2%
#4
17.9%
#5
12.4%
#6
11.3%
#7
9.3%
#8
8.2%
#9
8.2%
#10
7.6%
What city has the Highest Percentage of Population Employed in Farming, Fishing & Forestry in Pennsylvania?
Atlantic has the Highest Percentage of Population Employed in Farming, Fishing & Forestry in Pennsylvania with 37.5%.
What is the Percentage of Population Employed in Farming, Fishing & Forestry in the State of Pennsylvania?
Percentage of Population Employed in Farming, Fishing & Forestry in Pennsylvania is 0.41%.
What is the Percentage of Population Employed in Farming, Fishing & Forestry in the United States?
Percentage of Population Employed in Farming, Fishing & Forestry in the United States is 0.61%.