Cities with the Largest Portuguese Community in New York
RELATED REPORTS & OPTIONS
Portuguese
New York
Compare Cities
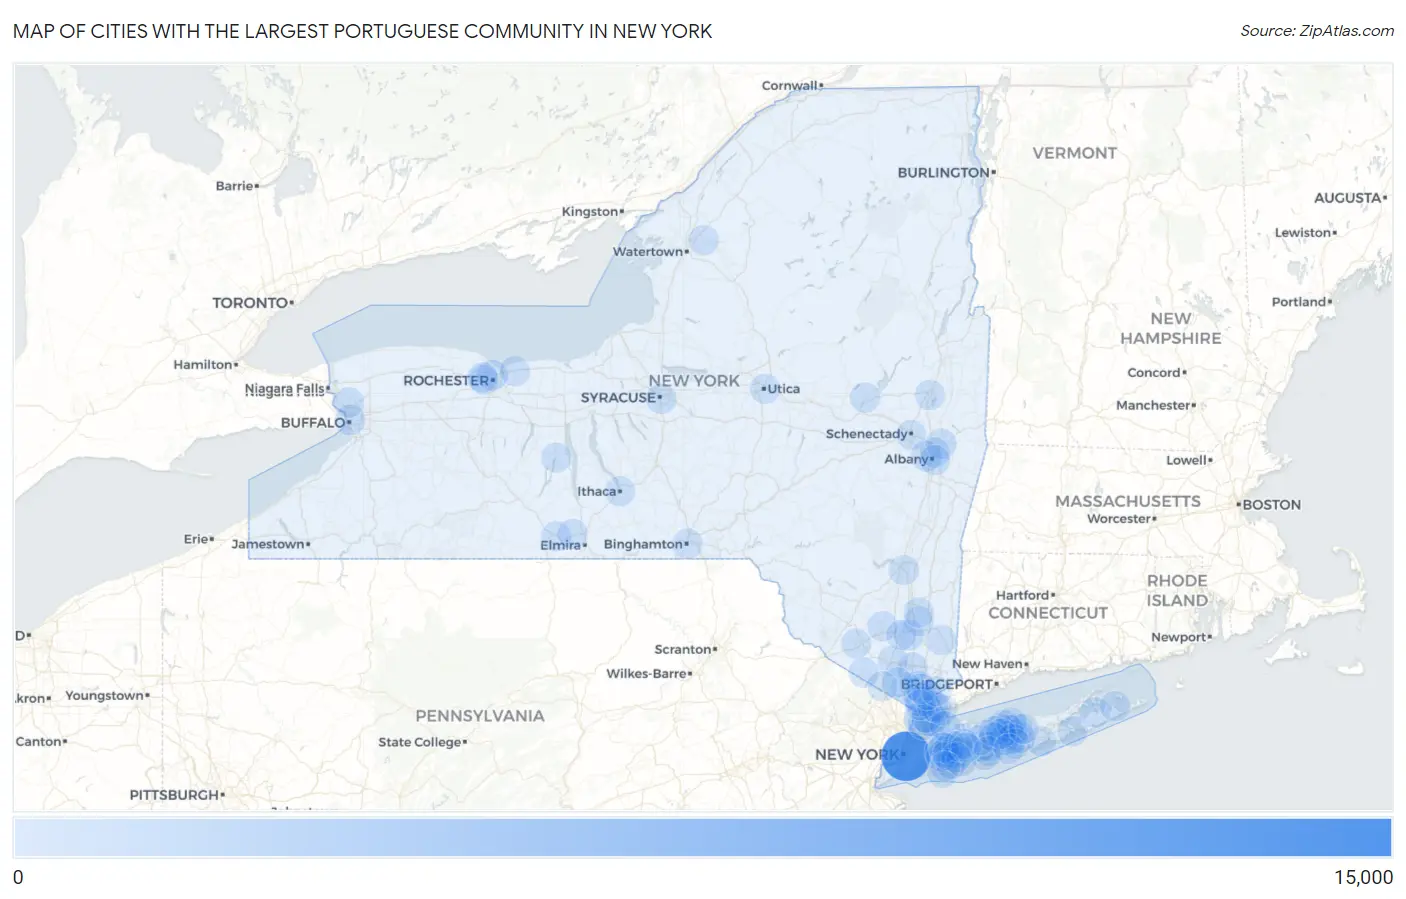
Map of Cities with the Largest Portuguese Community in New York
0
15,000
Cities with the Largest Portuguese Community in New York
| City | Portuguese | vs State | vs National | |
| 1. | New York | 14,646 | 49,927(29.33%)#1 | 1,351,314(1.08%)#3 |
| 2. | Yonkers | 1,856 | 49,927(3.72%)#2 | 1,351,314(0.14%)#74 |
| 3. | Mount Vernon | 1,374 | 49,927(2.75%)#3 | 1,351,314(0.10%)#108 |
| 4. | Mineola | 1,301 | 49,927(2.61%)#4 | 1,351,314(0.10%)#115 |
| 5. | Mamaroneck | 815 | 49,927(1.63%)#5 | 1,351,314(0.06%)#215 |
| 6. | East Meadow | 512 | 49,927(1.03%)#6 | 1,351,314(0.04%)#355 |
| 7. | New Rochelle | 509 | 49,927(1.02%)#7 | 1,351,314(0.04%)#358 |
| 8. | Rochester | 482 | 49,927(0.97%)#8 | 1,351,314(0.04%)#378 |
| 9. | New Hyde Park | 418 | 49,927(0.84%)#9 | 1,351,314(0.03%)#442 |
| 10. | Farmingville | 354 | 49,927(0.71%)#10 | 1,351,314(0.03%)#528 |
| 11. | Beacon | 353 | 49,927(0.71%)#11 | 1,351,314(0.03%)#531 |
| 12. | Eastchester | 333 | 49,927(0.67%)#12 | 1,351,314(0.02%)#562 |
| 13. | Albany | 332 | 49,927(0.66%)#13 | 1,351,314(0.02%)#565 |
| 14. | Long Beach | 325 | 49,927(0.65%)#14 | 1,351,314(0.02%)#582 |
| 15. | Westbury | 325 | 49,927(0.65%)#15 | 1,351,314(0.02%)#584 |
| 16. | Sleepy Hollow | 321 | 49,927(0.64%)#16 | 1,351,314(0.02%)#592 |
| 17. | Buffalo | 320 | 49,927(0.64%)#17 | 1,351,314(0.02%)#594 |
| 18. | Ossining | 263 | 49,927(0.53%)#18 | 1,351,314(0.02%)#696 |
| 19. | Stony Brook | 256 | 49,927(0.51%)#19 | 1,351,314(0.02%)#714 |
| 20. | Franklin Square | 246 | 49,927(0.49%)#20 | 1,351,314(0.02%)#732 |
| 21. | Tarrytown | 235 | 49,927(0.47%)#21 | 1,351,314(0.02%)#765 |
| 22. | Peekskill | 234 | 49,927(0.47%)#22 | 1,351,314(0.02%)#769 |
| 23. | Levittown | 222 | 49,927(0.44%)#23 | 1,351,314(0.02%)#814 |
| 24. | Medford | 222 | 49,927(0.44%)#24 | 1,351,314(0.02%)#815 |
| 25. | Selden | 221 | 49,927(0.44%)#25 | 1,351,314(0.02%)#817 |
| 26. | Troy | 215 | 49,927(0.43%)#26 | 1,351,314(0.02%)#837 |
| 27. | Deer Park | 205 | 49,927(0.41%)#27 | 1,351,314(0.02%)#867 |
| 28. | Freeport | 202 | 49,927(0.40%)#28 | 1,351,314(0.01%)#876 |
| 29. | Syracuse | 192 | 49,927(0.38%)#29 | 1,351,314(0.01%)#929 |
| 30. | Lake Ronkonkoma | 190 | 49,927(0.38%)#30 | 1,351,314(0.01%)#934 |
| 31. | White Plains | 187 | 49,927(0.37%)#31 | 1,351,314(0.01%)#945 |
| 32. | Syosset | 187 | 49,927(0.37%)#32 | 1,351,314(0.01%)#948 |
| 33. | Garden City | 181 | 49,927(0.36%)#33 | 1,351,314(0.01%)#973 |
| 34. | New City | 177 | 49,927(0.35%)#34 | 1,351,314(0.01%)#989 |
| 35. | Harrison | 177 | 49,927(0.35%)#35 | 1,351,314(0.01%)#990 |
| 36. | Commack | 171 | 49,927(0.34%)#36 | 1,351,314(0.01%)#1,020 |
| 37. | Coram | 170 | 49,927(0.34%)#37 | 1,351,314(0.01%)#1,024 |
| 38. | Port Chester | 169 | 49,927(0.34%)#38 | 1,351,314(0.01%)#1,032 |
| 39. | Carmel | 166 | 49,927(0.33%)#39 | 1,351,314(0.01%)#1,051 |
| 40. | Centereach | 160 | 49,927(0.32%)#40 | 1,351,314(0.01%)#1,080 |
| 41. | Myers Corner | 155 | 49,927(0.31%)#41 | 1,351,314(0.01%)#1,110 |
| 42. | Binghamton | 154 | 49,927(0.31%)#42 | 1,351,314(0.01%)#1,113 |
| 43. | West Islip | 154 | 49,927(0.31%)#43 | 1,351,314(0.01%)#1,114 |
| 44. | Carle Place | 142 | 49,927(0.28%)#44 | 1,351,314(0.01%)#1,184 |
| 45. | Ronkonkoma | 139 | 49,927(0.28%)#45 | 1,351,314(0.01%)#1,207 |
| 46. | North Bay Shore | 139 | 49,927(0.28%)#46 | 1,351,314(0.01%)#1,208 |
| 47. | Hempstead | 138 | 49,927(0.28%)#47 | 1,351,314(0.01%)#1,211 |
| 48. | Seaford | 135 | 49,927(0.27%)#48 | 1,351,314(0.01%)#1,244 |
| 49. | Dix Hills | 131 | 49,927(0.26%)#49 | 1,351,314(0.01%)#1,273 |
| 50. | Glen Cove | 130 | 49,927(0.26%)#50 | 1,351,314(0.01%)#1,283 |
| 51. | Hampton Bays | 129 | 49,927(0.26%)#51 | 1,351,314(0.01%)#1,293 |
| 52. | Woodbury | 127 | 49,927(0.25%)#52 | 1,351,314(0.01%)#1,313 |
| 53. | St James | 126 | 49,927(0.25%)#53 | 1,351,314(0.01%)#1,321 |
| 54. | Hicksville | 122 | 49,927(0.24%)#54 | 1,351,314(0.01%)#1,349 |
| 55. | Irvington | 117 | 49,927(0.23%)#55 | 1,351,314(0.01%)#1,391 |
| 56. | Walden | 115 | 49,927(0.23%)#56 | 1,351,314(0.01%)#1,410 |
| 57. | Greenville Cdp Westchester County | 111 | 49,927(0.22%)#57 | 1,351,314(0.01%)#1,444 |
| 58. | Briarcliff Manor | 108 | 49,927(0.22%)#58 | 1,351,314(0.01%)#1,473 |
| 59. | Smithtown | 107 | 49,927(0.21%)#59 | 1,351,314(0.01%)#1,478 |
| 60. | Williston Park | 106 | 49,927(0.21%)#60 | 1,351,314(0.01%)#1,499 |
| 61. | Plainview | 100 | 49,927(0.20%)#61 | 1,351,314(0.01%)#1,555 |
| 62. | Menands | 100 | 49,927(0.20%)#62 | 1,351,314(0.01%)#1,562 |
| 63. | North Bellmore | 99 | 49,927(0.20%)#63 | 1,351,314(0.01%)#1,564 |
| 64. | Gates | 98 | 49,927(0.20%)#64 | 1,351,314(0.01%)#1,580 |
| 65. | Hauppauge | 96 | 49,927(0.19%)#65 | 1,351,314(0.01%)#1,600 |
| 66. | Port Jefferson Station | 96 | 49,927(0.19%)#66 | 1,351,314(0.01%)#1,606 |
| 67. | Ithaca | 94 | 49,927(0.19%)#67 | 1,351,314(0.01%)#1,624 |
| 68. | North Patchogue | 94 | 49,927(0.19%)#68 | 1,351,314(0.01%)#1,631 |
| 69. | Gloversville | 90 | 49,927(0.18%)#69 | 1,351,314(0.01%)#1,684 |
| 70. | Pomona | 88 | 49,927(0.18%)#70 | 1,351,314(0.01%)#1,718 |
| 71. | Hawthorne | 85 | 49,927(0.17%)#71 | 1,351,314(0.01%)#1,752 |
| 72. | Utica | 84 | 49,927(0.17%)#72 | 1,351,314(0.01%)#1,754 |
| 73. | Middletown | 84 | 49,927(0.17%)#73 | 1,351,314(0.01%)#1,757 |
| 74. | Schenectady | 82 | 49,927(0.16%)#74 | 1,351,314(0.01%)#1,791 |
| 75. | Webster | 80 | 49,927(0.16%)#75 | 1,351,314(0.01%)#1,825 |
| 76. | Tonawanda | 79 | 49,927(0.16%)#76 | 1,351,314(0.01%)#1,836 |
| 77. | Armonk | 79 | 49,927(0.16%)#77 | 1,351,314(0.01%)#1,846 |
| 78. | Lake Carmel | 78 | 49,927(0.16%)#78 | 1,351,314(0.01%)#1,859 |
| 79. | Bay Shore | 76 | 49,927(0.15%)#79 | 1,351,314(0.01%)#1,889 |
| 80. | Center Moriches | 76 | 49,927(0.15%)#80 | 1,351,314(0.01%)#1,897 |
| 81. | Noyack | 76 | 49,927(0.15%)#81 | 1,351,314(0.01%)#1,900 |
| 82. | Newburgh | 74 | 49,927(0.15%)#82 | 1,351,314(0.01%)#1,926 |
| 83. | Holtsville | 74 | 49,927(0.15%)#83 | 1,351,314(0.01%)#1,932 |
| 84. | Nesconset | 74 | 49,927(0.15%)#84 | 1,351,314(0.01%)#1,934 |
| 85. | Corning | 74 | 49,927(0.15%)#85 | 1,351,314(0.01%)#1,936 |
| 86. | Saratoga Springs | 73 | 49,927(0.15%)#86 | 1,351,314(0.01%)#1,948 |
| 87. | Springs | 73 | 49,927(0.15%)#87 | 1,351,314(0.01%)#1,956 |
| 88. | Fort Drum | 72 | 49,927(0.14%)#88 | 1,351,314(0.01%)#1,966 |
| 89. | Old Bethpage | 71 | 49,927(0.14%)#89 | 1,351,314(0.01%)#1,992 |
| 90. | Red Oaks Mill | 71 | 49,927(0.14%)#90 | 1,351,314(0.01%)#1,993 |
| 91. | Warwick | 70 | 49,927(0.14%)#91 | 1,351,314(0.01%)#2,010 |
| 92. | Sloatsburg | 70 | 49,927(0.14%)#92 | 1,351,314(0.01%)#2,018 |
| 93. | Kingston | 69 | 49,927(0.14%)#93 | 1,351,314(0.01%)#2,030 |
| 94. | Big Flats | 69 | 49,927(0.14%)#94 | 1,351,314(0.01%)#2,037 |
| 95. | Sayville | 68 | 49,927(0.14%)#95 | 1,351,314(0.01%)#2,049 |
| 96. | Rensselaer | 68 | 49,927(0.14%)#96 | 1,351,314(0.01%)#2,055 |
| 97. | Penn Yan | 66 | 49,927(0.13%)#97 | 1,351,314(0.00%)#2,108 |
| 98. | Middle Island | 63 | 49,927(0.13%)#98 | 1,351,314(0.00%)#2,177 |
| 99. | North Gates | 63 | 49,927(0.13%)#99 | 1,351,314(0.00%)#2,178 |
| 100. | Oceanside | 62 | 49,927(0.12%)#100 | 1,351,314(0.00%)#2,197 |
Common Questions
What are the Top 10 Cities with the Largest Portuguese Community in New York?
Top 10 Cities with the Largest Portuguese Community in New York are:
#1
14,646
#2
1,856
#3
1,374
#4
1,301
#5
815
#6
512
#7
509
#8
482
#9
418
#10
354
What city has the Largest Portuguese Community in New York?
New York has the Largest Portuguese Community in New York with 14,646.
What is the Total Portuguese Population in the State of New York?
Total Portuguese Population in New York is 49,927.
What is the Total Portuguese Population in the United States?
Total Portuguese Population in the United States is 1,351,314.