Zip Codes with the Highest Percentage of Population with a Degree in Psychology in New Jersey
RELATED REPORTS & OPTIONS
Psychology
New Jersey
Compare Zip Codes
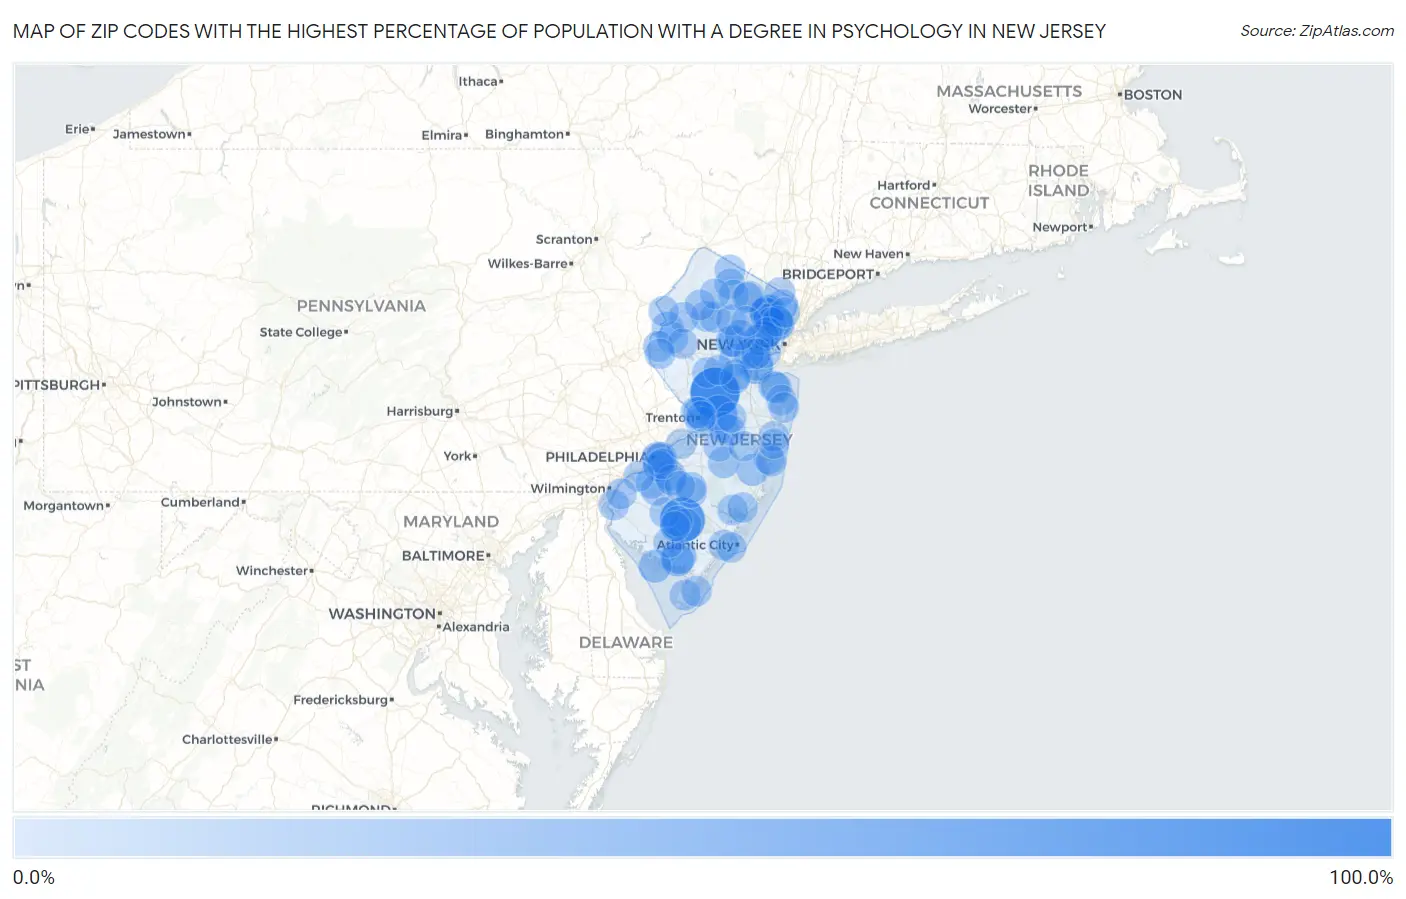
Map of Zip Codes with the Highest Percentage of Population with a Degree in Psychology in New Jersey
0.0%
100.0%
Zip Codes with the Highest Percentage of Population with a Degree in Psychology in New Jersey
| Zip Code | % Graduates | vs State | vs National | |
| 1. | 08528 | 85.3% | 5.5%(+79.8)#1 | 5.1%(+80.2)#37 |
| 2. | 08310 | 66.7% | 5.5%(+61.2)#2 | 5.1%(+61.6)#50 |
| 3. | 08561 | 35.4% | 5.5%(+29.9)#3 | 5.1%(+30.3)#214 |
| 4. | 08316 | 26.8% | 5.5%(+21.3)#4 | 5.1%(+21.8)#371 |
| 5. | 07514 | 21.5% | 5.5%(+16.0)#5 | 5.1%(+16.5)#567 |
| 6. | 07077 | 20.0% | 5.5%(+14.5)#6 | 5.1%(+14.9)#668 |
| 7. | 08327 | 18.6% | 5.5%(+13.1)#7 | 5.1%(+13.6)#755 |
| 8. | 08350 | 18.6% | 5.5%(+13.1)#8 | 5.1%(+13.6)#757 |
| 9. | 08321 | 18.5% | 5.5%(+13.0)#9 | 5.1%(+13.5)#766 |
| 10. | 07505 | 17.6% | 5.5%(+12.1)#10 | 5.1%(+12.5)#843 |
| 11. | 08103 | 16.9% | 5.5%(+11.4)#11 | 5.1%(+11.9)#909 |
| 12. | 07063 | 14.8% | 5.5%(+9.25)#12 | 5.1%(+9.71)#1,167 |
| 13. | 07064 | 14.7% | 5.5%(+9.18)#13 | 5.1%(+9.64)#1,174 |
| 14. | 08731 | 13.9% | 5.5%(+8.36)#14 | 5.1%(+8.83)#1,301 |
| 15. | 07606 | 13.6% | 5.5%(+8.10)#15 | 5.1%(+8.56)#1,352 |
| 16. | 07935 | 13.5% | 5.5%(+8.00)#16 | 5.1%(+8.46)#1,378 |
| 17. | 07823 | 13.0% | 5.5%(+7.52)#17 | 5.1%(+7.99)#1,475 |
| 18. | 07524 | 12.8% | 5.5%(+7.33)#18 | 5.1%(+7.79)#1,512 |
| 19. | 08618 | 12.6% | 5.5%(+7.13)#19 | 5.1%(+7.59)#1,560 |
| 20. | 08051 | 12.5% | 5.5%(+7.03)#20 | 5.1%(+7.49)#1,577 |
| 21. | 08015 | 12.5% | 5.5%(+7.00)#21 | 5.1%(+7.46)#1,579 |
| 22. | 08102 | 12.0% | 5.5%(+6.45)#22 | 5.1%(+6.92)#1,736 |
| 23. | 07976 | 11.7% | 5.5%(+6.22)#23 | 5.1%(+6.68)#1,816 |
| 24. | 08611 | 11.7% | 5.5%(+6.18)#24 | 5.1%(+6.64)#1,825 |
| 25. | 07882 | 11.7% | 5.5%(+6.14)#25 | 5.1%(+6.60)#1,834 |
| 26. | 07074 | 11.6% | 5.5%(+6.05)#26 | 5.1%(+6.52)#1,864 |
| 27. | 07206 | 11.4% | 5.5%(+5.94)#27 | 5.1%(+6.40)#1,895 |
| 28. | 08084 | 11.4% | 5.5%(+5.86)#28 | 5.1%(+6.32)#1,914 |
| 29. | 08904 | 11.3% | 5.5%(+5.78)#29 | 5.1%(+6.24)#1,945 |
| 30. | 08030 | 11.2% | 5.5%(+5.66)#30 | 5.1%(+6.12)#1,986 |
| 31. | 07758 | 11.1% | 5.5%(+5.62)#31 | 5.1%(+6.08)#2,002 |
| 32. | 07718 | 11.1% | 5.5%(+5.57)#32 | 5.1%(+6.03)#2,033 |
| 33. | 08638 | 10.9% | 5.5%(+5.39)#33 | 5.1%(+5.86)#2,097 |
| 34. | 08501 | 10.7% | 5.5%(+5.23)#34 | 5.1%(+5.70)#2,158 |
| 35. | 08886 | 10.5% | 5.5%(+4.99)#35 | 5.1%(+5.45)#2,256 |
| 36. | 07504 | 10.5% | 5.5%(+4.98)#36 | 5.1%(+5.44)#2,261 |
| 37. | 08089 | 10.4% | 5.5%(+4.87)#37 | 5.1%(+5.33)#2,299 |
| 38. | 08732 | 10.2% | 5.5%(+4.71)#38 | 5.1%(+5.17)#2,373 |
| 39. | 08242 | 10.2% | 5.5%(+4.68)#39 | 5.1%(+5.14)#2,397 |
| 40. | 07630 | 10.2% | 5.5%(+4.67)#40 | 5.1%(+5.13)#2,404 |
| 41. | 08105 | 10.1% | 5.5%(+4.61)#41 | 5.1%(+5.07)#2,432 |
| 42. | 07857 | 10.1% | 5.5%(+4.54)#42 | 5.1%(+5.00)#2,464 |
| 43. | 07522 | 10.0% | 5.5%(+4.50)#43 | 5.1%(+4.96)#2,479 |
| 44. | 08071 | 10.0% | 5.5%(+4.46)#44 | 5.1%(+4.92)#2,514 |
| 45. | 07847 | 9.9% | 5.5%(+4.37)#45 | 5.1%(+4.84)#2,560 |
| 46. | 08021 | 9.9% | 5.5%(+4.37)#46 | 5.1%(+4.84)#2,561 |
| 47. | 08328 | 9.8% | 5.5%(+4.29)#47 | 5.1%(+4.75)#2,600 |
| 48. | 07017 | 9.8% | 5.5%(+4.27)#48 | 5.1%(+4.73)#2,611 |
| 49. | 08821 | 9.8% | 5.5%(+4.24)#49 | 5.1%(+4.70)#2,631 |
| 50. | 07462 | 9.7% | 5.5%(+4.17)#50 | 5.1%(+4.63)#2,673 |
| 51. | 08107 | 9.5% | 5.5%(+4.02)#51 | 5.1%(+4.49)#2,754 |
| 52. | 07838 | 9.5% | 5.5%(+4.02)#52 | 5.1%(+4.48)#2,760 |
| 53. | 07821 | 9.4% | 5.5%(+3.88)#53 | 5.1%(+4.34)#2,846 |
| 54. | 07739 | 9.3% | 5.5%(+3.82)#54 | 5.1%(+4.28)#2,882 |
| 55. | 08514 | 9.3% | 5.5%(+3.78)#55 | 5.1%(+4.24)#2,919 |
| 56. | 08027 | 9.3% | 5.5%(+3.77)#56 | 5.1%(+4.24)#2,920 |
| 57. | 08070 | 9.2% | 5.5%(+3.73)#57 | 5.1%(+4.20)#2,950 |
| 58. | 07011 | 9.2% | 5.5%(+3.70)#58 | 5.1%(+4.17)#2,979 |
| 59. | 07055 | 9.2% | 5.5%(+3.67)#59 | 5.1%(+4.13)#2,994 |
| 60. | 07878 | 9.2% | 5.5%(+3.66)#60 | 5.1%(+4.12)#3,003 |
| 61. | 07107 | 9.1% | 5.5%(+3.63)#61 | 5.1%(+4.09)#3,019 |
| 62. | 08004 | 9.1% | 5.5%(+3.63)#62 | 5.1%(+4.09)#3,020 |
| 63. | 08069 | 9.1% | 5.5%(+3.62)#63 | 5.1%(+4.08)#3,029 |
| 64. | 07420 | 9.1% | 5.5%(+3.61)#64 | 5.1%(+4.07)#3,031 |
| 65. | 07645 | 9.1% | 5.5%(+3.60)#65 | 5.1%(+4.06)#3,037 |
| 66. | 08224 | 9.1% | 5.5%(+3.58)#66 | 5.1%(+4.04)#3,077 |
| 67. | 08641 | 9.1% | 5.5%(+3.56)#67 | 5.1%(+4.02)#3,087 |
| 68. | 08247 | 9.0% | 5.5%(+3.49)#68 | 5.1%(+3.95)#3,127 |
| 69. | 08225 | 9.0% | 5.5%(+3.46)#69 | 5.1%(+3.92)#3,160 |
| 70. | 07106 | 9.0% | 5.5%(+3.44)#70 | 5.1%(+3.91)#3,175 |
| 71. | 07027 | 8.9% | 5.5%(+3.42)#71 | 5.1%(+3.88)#3,198 |
| 72. | 08332 | 8.9% | 5.5%(+3.38)#72 | 5.1%(+3.85)#3,223 |
| 73. | 08341 | 8.8% | 5.5%(+3.32)#73 | 5.1%(+3.78)#3,274 |
| 74. | 07460 | 8.8% | 5.5%(+3.32)#74 | 5.1%(+3.78)#3,282 |
| 75. | 07604 | 8.8% | 5.5%(+3.30)#75 | 5.1%(+3.77)#3,292 |
| 76. | 07109 | 8.8% | 5.5%(+3.29)#76 | 5.1%(+3.75)#3,302 |
| 77. | 07203 | 8.8% | 5.5%(+3.25)#77 | 5.1%(+3.71)#3,335 |
| 78. | 08740 | 8.7% | 5.5%(+3.17)#78 | 5.1%(+3.63)#3,428 |
| 79. | 07932 | 8.6% | 5.5%(+3.13)#79 | 5.1%(+3.59)#3,464 |
| 80. | 07832 | 8.6% | 5.5%(+3.12)#80 | 5.1%(+3.58)#3,478 |
| 81. | 08087 | 8.5% | 5.5%(+3.03)#81 | 5.1%(+3.49)#3,566 |
| 82. | 08724 | 8.5% | 5.5%(+3.02)#82 | 5.1%(+3.48)#3,579 |
| 83. | 07435 | 8.5% | 5.5%(+3.01)#83 | 5.1%(+3.47)#3,584 |
| 84. | 07403 | 8.5% | 5.5%(+3.01)#84 | 5.1%(+3.47)#3,585 |
| 85. | 08360 | 8.5% | 5.5%(+2.99)#85 | 5.1%(+3.45)#3,601 |
| 86. | 08406 | 8.4% | 5.5%(+2.92)#86 | 5.1%(+3.38)#3,677 |
| 87. | 08723 | 8.4% | 5.5%(+2.86)#87 | 5.1%(+3.32)#3,733 |
| 88. | 07764 | 8.3% | 5.5%(+2.81)#88 | 5.1%(+3.27)#3,800 |
| 89. | 08609 | 8.3% | 5.5%(+2.74)#89 | 5.1%(+3.21)#3,849 |
| 90. | 07871 | 8.2% | 5.5%(+2.73)#90 | 5.1%(+3.19)#3,863 |
| 91. | 08010 | 8.2% | 5.5%(+2.71)#91 | 5.1%(+3.17)#3,883 |
| 92. | 08733 | 8.2% | 5.5%(+2.67)#92 | 5.1%(+3.13)#3,917 |
| 93. | 08826 | 8.1% | 5.5%(+2.61)#93 | 5.1%(+3.07)#3,990 |
| 94. | 08555 | 8.1% | 5.5%(+2.59)#94 | 5.1%(+3.05)#4,020 |
| 95. | 07058 | 8.1% | 5.5%(+2.57)#95 | 5.1%(+3.03)#4,029 |
| 96. | 08901 | 8.1% | 5.5%(+2.56)#96 | 5.1%(+3.02)#4,045 |
| 97. | 08835 | 8.1% | 5.5%(+2.56)#97 | 5.1%(+3.02)#4,047 |
| 98. | 07621 | 8.0% | 5.5%(+2.53)#98 | 5.1%(+2.99)#4,073 |
| 99. | 08009 | 8.0% | 5.5%(+2.48)#99 | 5.1%(+2.94)#4,147 |
| 100. | 08804 | 8.0% | 5.5%(+2.45)#100 | 5.1%(+2.91)#4,183 |
Common Questions
What are the Top 10 Zip Codes with the Highest Percentage of Population with a Degree in Psychology in New Jersey?
Top 10 Zip Codes with the Highest Percentage of Population with a Degree in Psychology in New Jersey are:
What zip code has the Highest Percentage of Population with a Degree in Psychology in New Jersey?
08528 has the Highest Percentage of Population with a Degree in Psychology in New Jersey with 85.3%.
What is the Percentage of Population with a Degree in Psychology in the State of New Jersey?
Percentage of Population with a Degree in Psychology in New Jersey is 5.5%.
What is the Percentage of Population with a Degree in Psychology in the United States?
Percentage of Population with a Degree in Psychology in the United States is 5.1%.