Zip Codes with the Highest Percentage of Population with a Degree in Psychology in Millstone Township, NJ
RELATED REPORTS & OPTIONS
Psychology
Millstone Township
Compare Zip Codes
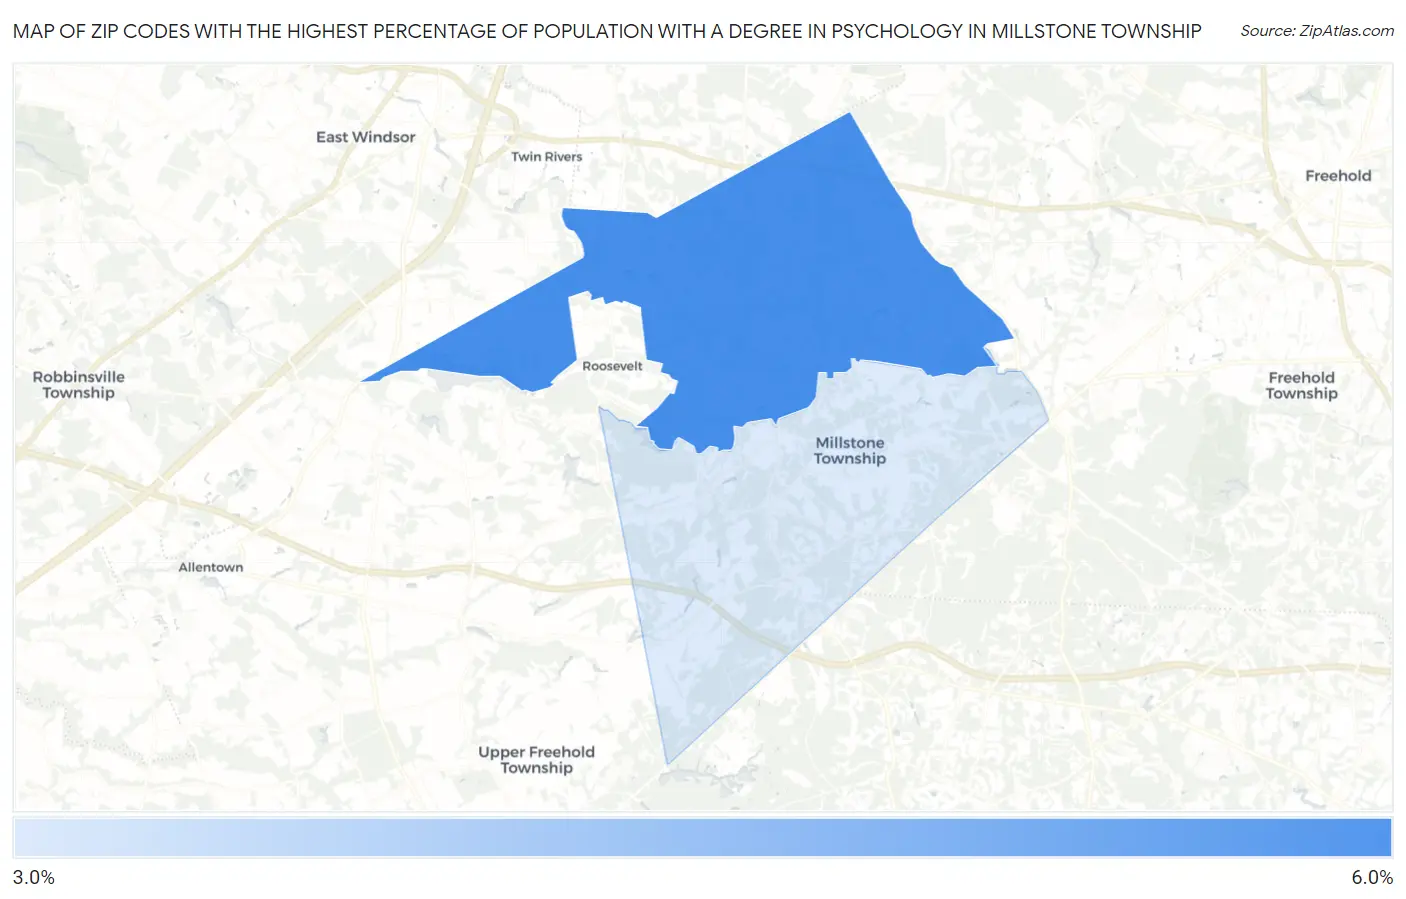
Map of Zip Codes with the Highest Percentage of Population with a Degree in Psychology in Millstone Township
3.1%
5.9%
Zip Codes with the Highest Percentage of Population with a Degree in Psychology in Millstone Township, NJ
| Zip Code | % Graduates | vs State | vs National | |
| 1. | 08535 | 5.9% | 5.5%(+0.343)#246 | 5.1%(+0.805)#8,396 |
| 2. | 08510 | 3.1% | 5.5%(-2.38)#492 | 5.1%(-1.92)#17,837 |
1
Common Questions
What are the Top Zip Codes with the Highest Percentage of Population with a Degree in Psychology in Millstone Township, NJ?
Top Zip Codes with the Highest Percentage of Population with a Degree in Psychology in Millstone Township, NJ are:
What zip code has the Highest Percentage of Population with a Degree in Psychology in Millstone Township, NJ?
08535 has the Highest Percentage of Population with a Degree in Psychology in Millstone Township, NJ with 5.9%.
What is the Percentage of Population with a Degree in Psychology in New Jersey?
Percentage of Population with a Degree in Psychology in New Jersey is 5.5%.
What is the Percentage of Population with a Degree in Psychology in the United States?
Percentage of Population with a Degree in Psychology in the United States is 5.1%.