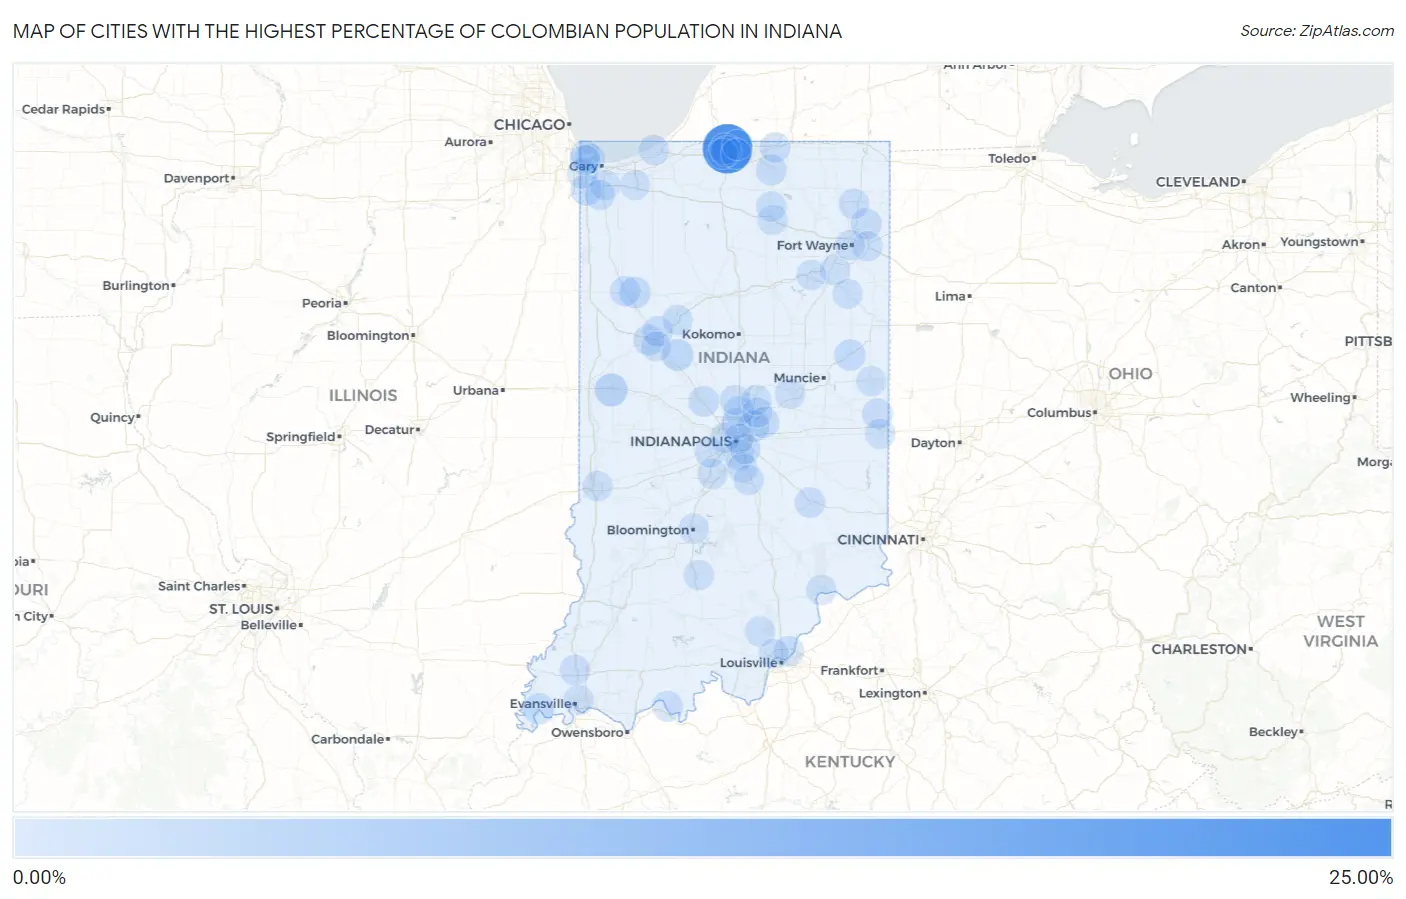
Cities with the Highest Percentage of Colombian Population in Indiana
RELATED REPORTS & OPTIONS
Colombian
Indiana
Compare Cities
Map of Cities with the Highest Percentage of Colombian Population in Indiana
0.00%
25.00%
Cities with the Highest Percentage of Colombian Population in Indiana
| City | Colombian | vs State | vs National | |
| 1. | Indian Village | 22.56% | 0.078%(+22.5)#1 | 0.41%(+22.1)#8 |
| 2. | Veedersburg | 3.08% | 0.078%(+3.00)#2 | 0.41%(+2.67)#350 |
| 3. | Mulberry | 1.72% | 0.078%(+1.64)#3 | 0.41%(+1.31)#672 |
| 4. | Wolcott | 1.38% | 0.078%(+1.30)#4 | 0.41%(+0.972)#849 |
| 5. | Gilmer Park | 1.29% | 0.078%(+1.21)#5 | 0.41%(+0.876)#908 |
| 6. | St John | 1.28% | 0.078%(+1.21)#6 | 0.41%(+0.873)#914 |
| 7. | Redkey | 1.23% | 0.078%(+1.15)#7 | 0.41%(+0.818)#958 |
| 8. | Lawrence | 1.07% | 0.078%(+0.993)#8 | 0.41%(+0.661)#1,083 |
| 9. | Mount Vernon | 0.99% | 0.078%(+0.910)#9 | 0.41%(+0.578)#1,155 |
| 10. | Leo Cedarville | 0.93% | 0.078%(+0.854)#10 | 0.41%(+0.522)#1,210 |
| 11. | Mccordsville | 0.92% | 0.078%(+0.846)#11 | 0.41%(+0.513)#1,230 |
| 12. | Homecroft | 0.81% | 0.078%(+0.737)#12 | 0.41%(+0.404)#1,376 |
| 13. | West Lafayette | 0.73% | 0.078%(+0.656)#13 | 0.41%(+0.323)#1,504 |
| 14. | Beech Grove | 0.68% | 0.078%(+0.601)#14 | 0.41%(+0.268)#1,612 |
| 15. | Lebanon | 0.65% | 0.078%(+0.571)#15 | 0.41%(+0.238)#1,667 |
| 16. | Goshen | 0.58% | 0.078%(+0.502)#16 | 0.41%(+0.169)#1,836 |
| 17. | Meridian Hills | 0.57% | 0.078%(+0.495)#17 | 0.41%(+0.163)#1,849 |
| 18. | Tell City | 0.55% | 0.078%(+0.471)#18 | 0.41%(+0.139)#1,935 |
| 19. | Fountain City | 0.52% | 0.078%(+0.440)#19 | 0.41%(+0.107)#2,019 |
| 20. | Roseland | 0.50% | 0.078%(+0.426)#20 | 0.41%(+0.094)#2,061 |
| 21. | Greensburg | 0.45% | 0.078%(+0.377)#21 | 0.41%(+0.045)#2,196 |
| 22. | Garrett | 0.44% | 0.078%(+0.358)#22 | 0.41%(+0.025)#2,268 |
| 23. | Haubstadt | 0.42% | 0.078%(+0.345)#23 | 0.41%(+0.013)#2,323 |
| 24. | Battle Ground | 0.39% | 0.078%(+0.308)#24 | 0.41%(-0.024)#2,470 |
| 25. | Remington | 0.34% | 0.078%(+0.259)#25 | 0.41%(-0.074)#2,670 |
| 26. | Michigan City | 0.33% | 0.078%(+0.257)#26 | 0.41%(-0.076)#2,679 |
| 27. | Notre Dame | 0.32% | 0.078%(+0.247)#27 | 0.41%(-0.086)#2,721 |
| 28. | Jeffersonville | 0.30% | 0.078%(+0.224)#28 | 0.41%(-0.109)#2,857 |
| 29. | Whiting | 0.24% | 0.078%(+0.163)#29 | 0.41%(-0.170)#3,186 |
| 30. | Delphi | 0.23% | 0.078%(+0.157)#30 | 0.41%(-0.176)#3,234 |
| 31. | Carmel | 0.23% | 0.078%(+0.154)#31 | 0.41%(-0.179)#3,258 |
| 32. | Bristol | 0.21% | 0.078%(+0.137)#32 | 0.41%(-0.195)#3,369 |
| 33. | Leesburg | 0.21% | 0.078%(+0.135)#33 | 0.41%(-0.198)#3,385 |
| 34. | Munster | 0.21% | 0.078%(+0.129)#34 | 0.41%(-0.204)#3,425 |
| 35. | Warsaw | 0.19% | 0.078%(+0.117)#35 | 0.41%(-0.216)#3,496 |
| 36. | Zanesville | 0.19% | 0.078%(+0.111)#36 | 0.41%(-0.221)#3,526 |
| 37. | Bedford | 0.18% | 0.078%(+0.104)#37 | 0.41%(-0.229)#3,594 |
| 38. | Bloomington | 0.18% | 0.078%(+0.101)#38 | 0.41%(-0.232)#3,606 |
| 39. | Greenwood | 0.17% | 0.078%(+0.091)#39 | 0.41%(-0.242)#3,680 |
| 40. | Speedway | 0.15% | 0.078%(+0.076)#40 | 0.41%(-0.256)#3,782 |
| 41. | South Bend | 0.14% | 0.078%(+0.067)#41 | 0.41%(-0.266)#3,866 |
| 42. | Winchester | 0.13% | 0.078%(+0.051)#42 | 0.41%(-0.281)#3,992 |
| 43. | Valparaiso | 0.13% | 0.078%(+0.049)#43 | 0.41%(-0.284)#4,013 |
| 44. | Anderson | 0.11% | 0.078%(+0.028)#44 | 0.41%(-0.305)#4,202 |
| 45. | Borden | 0.10% | 0.078%(+0.027)#45 | 0.41%(-0.306)#4,209 |
| 46. | New Haven | 0.096% | 0.078%(+0.019)#46 | 0.41%(-0.314)#4,283 |
| 47. | Terre Haute | 0.092% | 0.078%(+0.015)#47 | 0.41%(-0.318)#4,319 |
| 48. | Madison | 0.089% | 0.078%(+0.012)#48 | 0.41%(-0.321)#4,346 |
| 49. | Indianapolis | 0.080% | 0.078%(+0.003)#49 | 0.41%(-0.330)#4,425 |
| 50. | East Chicago | 0.076% | 0.078%(-0.002)#50 | 0.41%(-0.334)#4,472 |
| 51. | Westfield | 0.075% | 0.078%(-0.003)#51 | 0.41%(-0.335)#4,485 |
| 52. | Hammond | 0.074% | 0.078%(-0.004)#52 | 0.41%(-0.336)#4,500 |
| 53. | Merrillville | 0.069% | 0.078%(-0.009)#53 | 0.41%(-0.341)#4,556 |
| 54. | Fort Wayne | 0.067% | 0.078%(-0.010)#54 | 0.41%(-0.343)#4,574 |
| 55. | Fishers | 0.067% | 0.078%(-0.011)#55 | 0.41%(-0.343)#4,577 |
| 56. | Granger | 0.067% | 0.078%(-0.011)#56 | 0.41%(-0.343)#4,578 |
| 57. | Richmond | 0.065% | 0.078%(-0.013)#57 | 0.41%(-0.346)#4,608 |
| 58. | Crown Point | 0.062% | 0.078%(-0.015)#58 | 0.41%(-0.348)#4,626 |
| 59. | New Albany | 0.056% | 0.078%(-0.022)#59 | 0.41%(-0.354)#4,680 |
| 60. | Noblesville | 0.055% | 0.078%(-0.022)#60 | 0.41%(-0.355)#4,681 |
| 61. | Lafayette | 0.051% | 0.078%(-0.027)#61 | 0.41%(-0.359)#4,717 |
| 62. | Brooklyn | 0.044% | 0.078%(-0.033)#62 | 0.41%(-0.366)#4,766 |
| 63. | Mishawaka | 0.037% | 0.078%(-0.040)#63 | 0.41%(-0.373)#4,834 |
| 64. | Plainfield | 0.031% | 0.078%(-0.046)#64 | 0.41%(-0.379)#4,890 |
| 65. | Evansville | 0.027% | 0.078%(-0.051)#65 | 0.41%(-0.384)#4,937 |
| 66. | Huntington | 0.024% | 0.078%(-0.054)#66 | 0.41%(-0.387)#4,959 |
| 67. | Franklin | 0.023% | 0.078%(-0.055)#67 | 0.41%(-0.387)#4,963 |
| 68. | Bluffton | 0.0096% | 0.078%(-0.068)#68 | 0.41%(-0.401)#5,050 |
Common Questions
What are the Top 10 Cities with the Highest Percentage of Colombian Population in Indiana?
Top 10 Cities with the Highest Percentage of Colombian Population in Indiana are:
#1
22.56%
#2
3.08%
#3
1.72%
#4
1.38%
#5
1.28%
#6
1.23%
#7
1.07%
#8
0.99%
#9
0.93%
#10
0.92%
What city has the Highest Percentage of Colombian Population in Indiana?
Indian Village has the Highest Percentage of Colombian Population in Indiana with 22.56%.
What is the Percentage of Colombian Population in the State of Indiana?
Percentage of Colombian Population in Indiana is 0.078%.
What is the Percentage of Colombian Population in the United States?
Percentage of Colombian Population in the United States is 0.41%.