Cities with the Highest Percentage of Colombian Population in Michigan
RELATED REPORTS & OPTIONS
Colombian
Michigan
Compare Cities
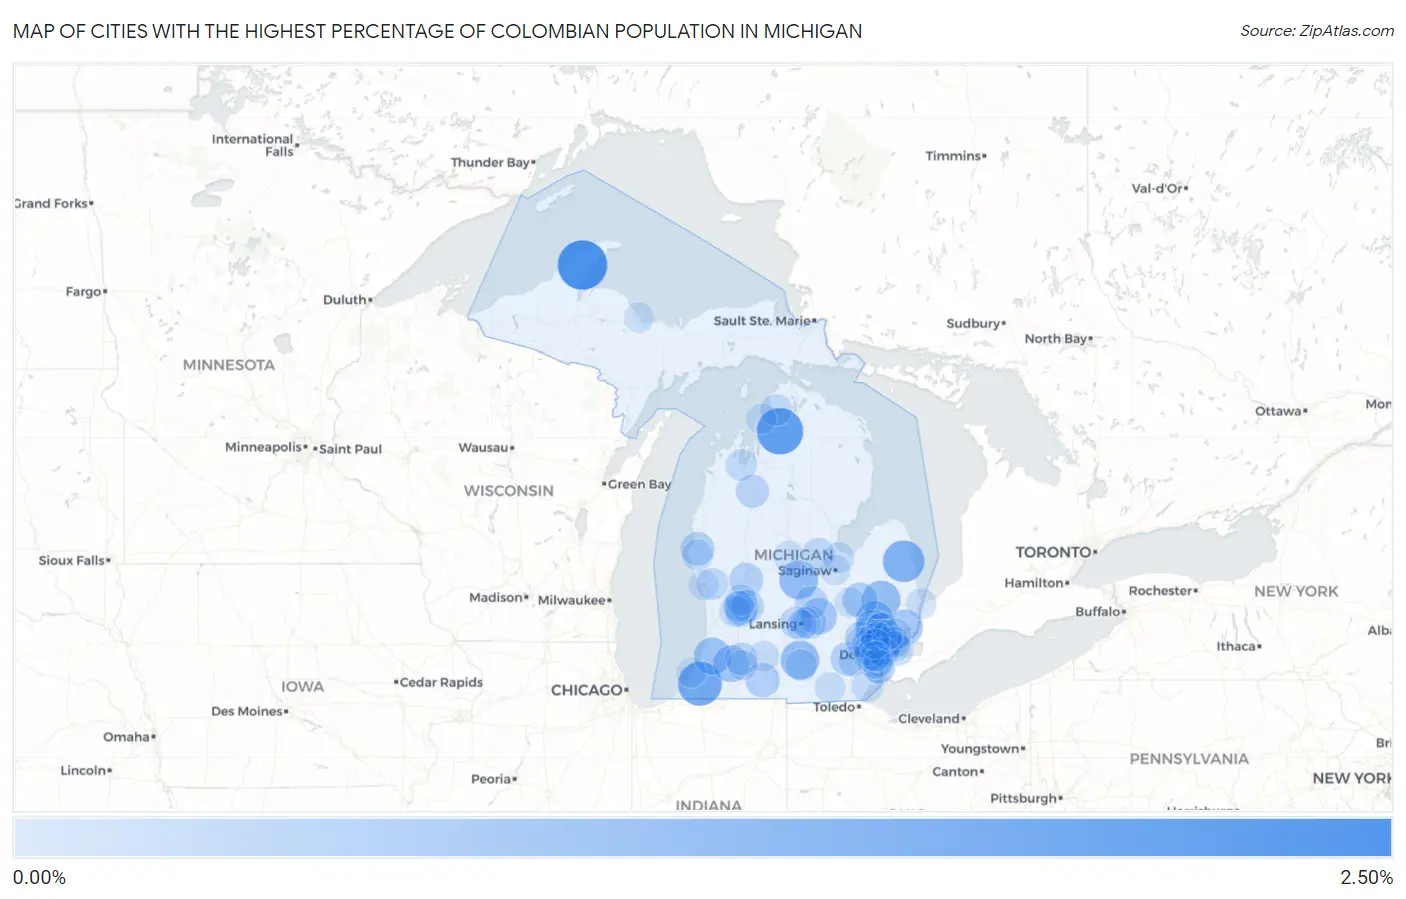
Map of Cities with the Highest Percentage of Colombian Population in Michigan
0.00%
2.50%
Cities with the Highest Percentage of Colombian Population in Michigan
| City | Colombian | vs State | vs National | |
| 1. | Lake Linden | 2.11% | 0.074%(+2.04)#1 | 0.41%(+1.70)#536 |
| 2. | Boyne Falls | 1.76% | 0.074%(+1.69)#2 | 0.41%(+1.35)#650 |
| 3. | Berrien Springs | 1.48% | 0.074%(+1.41)#3 | 0.41%(+1.07)#782 |
| 4. | Deckerville | 1.23% | 0.074%(+1.15)#4 | 0.41%(+0.817)#961 |
| 5. | Pleasant Ridge | 1.15% | 0.074%(+1.08)#5 | 0.41%(+0.740)#1,020 |
| 6. | Ithaca | 0.92% | 0.074%(+0.842)#6 | 0.41%(+0.505)#1,239 |
| 7. | Parma | 0.90% | 0.074%(+0.831)#7 | 0.41%(+0.495)#1,253 |
| 8. | Attica | 0.89% | 0.074%(+0.818)#8 | 0.41%(+0.482)#1,270 |
| 9. | Lake Orion | 0.82% | 0.074%(+0.749)#9 | 0.41%(+0.413)#1,360 |
| 10. | Auburn Hills | 0.81% | 0.074%(+0.731)#10 | 0.41%(+0.395)#1,387 |
| 11. | Bangor | 0.77% | 0.074%(+0.700)#11 | 0.41%(+0.364)#1,433 |
| 12. | Mattawan | 0.70% | 0.074%(+0.628)#12 | 0.41%(+0.291)#1,571 |
| 13. | Perry | 0.66% | 0.074%(+0.584)#13 | 0.41%(+0.248)#1,649 |
| 14. | New Baltimore | 0.59% | 0.074%(+0.513)#14 | 0.41%(+0.176)#1,811 |
| 15. | Davison | 0.49% | 0.074%(+0.415)#15 | 0.41%(+0.079)#2,100 |
| 16. | Sherwood | 0.45% | 0.074%(+0.373)#16 | 0.41%(+0.036)#2,229 |
| 17. | East Grand Rapids | 0.44% | 0.074%(+0.365)#17 | 0.41%(+0.029)#2,249 |
| 18. | Sand Lake | 0.41% | 0.074%(+0.333)#18 | 0.41%(-0.004)#2,380 |
| 19. | Ann Arbor | 0.40% | 0.074%(+0.325)#19 | 0.41%(-0.012)#2,419 |
| 20. | Hart | 0.37% | 0.074%(+0.294)#20 | 0.41%(-0.042)#2,536 |
| 21. | Manton | 0.30% | 0.074%(+0.229)#21 | 0.41%(-0.108)#2,847 |
| 22. | Forest Hills | 0.28% | 0.074%(+0.211)#22 | 0.41%(-0.125)#2,938 |
| 23. | Haslett | 0.28% | 0.074%(+0.209)#23 | 0.41%(-0.127)#2,956 |
| 24. | Ovid | 0.28% | 0.074%(+0.203)#24 | 0.41%(-0.133)#2,998 |
| 25. | Kalamazoo | 0.26% | 0.074%(+0.189)#25 | 0.41%(-0.147)#3,070 |
| 26. | Pontiac | 0.26% | 0.074%(+0.186)#26 | 0.41%(-0.150)#3,091 |
| 27. | Wolverine Lake | 0.24% | 0.074%(+0.171)#27 | 0.41%(-0.165)#3,154 |
| 28. | Waverly | 0.22% | 0.074%(+0.145)#28 | 0.41%(-0.191)#3,341 |
| 29. | Kentwood | 0.19% | 0.074%(+0.120)#29 | 0.41%(-0.216)#3,494 |
| 30. | Wolf Lake | 0.19% | 0.074%(+0.120)#30 | 0.41%(-0.216)#3,499 |
| 31. | Grosse Pointe Farms | 0.19% | 0.074%(+0.116)#31 | 0.41%(-0.220)#3,520 |
| 32. | Franklin | 0.19% | 0.074%(+0.115)#32 | 0.41%(-0.222)#3,528 |
| 33. | Harbor Springs | 0.18% | 0.074%(+0.109)#33 | 0.41%(-0.227)#3,574 |
| 34. | Midland | 0.17% | 0.074%(+0.101)#34 | 0.41%(-0.236)#3,633 |
| 35. | Rochester | 0.17% | 0.074%(+0.096)#35 | 0.41%(-0.241)#3,671 |
| 36. | Monroe | 0.17% | 0.074%(+0.093)#36 | 0.41%(-0.243)#3,695 |
| 37. | Spring Arbor | 0.17% | 0.074%(+0.092)#37 | 0.41%(-0.244)#3,702 |
| 38. | Farmington Hills | 0.16% | 0.074%(+0.088)#38 | 0.41%(-0.249)#3,724 |
| 39. | Traverse City | 0.16% | 0.074%(+0.081)#39 | 0.41%(-0.255)#3,770 |
| 40. | Wyoming | 0.16% | 0.074%(+0.081)#40 | 0.41%(-0.255)#3,771 |
| 41. | Taylor | 0.15% | 0.074%(+0.077)#41 | 0.41%(-0.259)#3,804 |
| 42. | Farmington | 0.14% | 0.074%(+0.065)#42 | 0.41%(-0.271)#3,906 |
| 43. | Riverview | 0.14% | 0.074%(+0.063)#43 | 0.41%(-0.273)#3,924 |
| 44. | Rochester Hills | 0.14% | 0.074%(+0.063)#44 | 0.41%(-0.273)#3,926 |
| 45. | Northview | 0.13% | 0.074%(+0.056)#45 | 0.41%(-0.280)#3,988 |
| 46. | Shelby | 0.12% | 0.074%(+0.045)#46 | 0.41%(-0.291)#4,080 |
| 47. | Westland | 0.11% | 0.074%(+0.038)#47 | 0.41%(-0.298)#4,140 |
| 48. | Roseville | 0.099% | 0.074%(+0.025)#48 | 0.41%(-0.311)#4,255 |
| 49. | Mount Pleasant | 0.096% | 0.074%(+0.022)#49 | 0.41%(-0.314)#4,285 |
| 50. | Trenton | 0.092% | 0.074%(+0.018)#50 | 0.41%(-0.318)#4,317 |
| 51. | Clawson | 0.088% | 0.074%(+0.014)#51 | 0.41%(-0.322)#4,360 |
| 52. | Royal Oak | 0.084% | 0.074%(+0.010)#52 | 0.41%(-0.326)#4,385 |
| 53. | Bay City | 0.083% | 0.074%(+0.009)#53 | 0.41%(-0.327)#4,403 |
| 54. | Grand Rapids | 0.076% | 0.074%(+0.002)#54 | 0.41%(-0.334)#4,475 |
| 55. | Troy | 0.075% | 0.074%(+0.001)#55 | 0.41%(-0.336)#4,486 |
| 56. | Birmingham | 0.074% | 0.074%(-0.000)#56 | 0.41%(-0.336)#4,502 |
| 57. | St Clair Shores | 0.073% | 0.074%(-0.001)#57 | 0.41%(-0.337)#4,508 |
| 58. | Battle Creek | 0.072% | 0.074%(-0.001)#58 | 0.41%(-0.338)#4,515 |
| 59. | Dearborn | 0.072% | 0.074%(-0.002)#59 | 0.41%(-0.338)#4,519 |
| 60. | Garden City | 0.070% | 0.074%(-0.004)#60 | 0.41%(-0.340)#4,542 |
| 61. | Ypsilanti | 0.069% | 0.074%(-0.005)#61 | 0.41%(-0.341)#4,551 |
| 62. | Adrian | 0.068% | 0.074%(-0.006)#62 | 0.41%(-0.342)#4,567 |
| 63. | East Lansing | 0.064% | 0.074%(-0.010)#63 | 0.41%(-0.346)#4,614 |
| 64. | Lansing | 0.058% | 0.074%(-0.016)#64 | 0.41%(-0.352)#4,660 |
| 65. | Warren | 0.054% | 0.074%(-0.020)#65 | 0.41%(-0.356)#4,689 |
| 66. | Mount Clemens | 0.051% | 0.074%(-0.023)#66 | 0.41%(-0.359)#4,714 |
| 67. | Novi | 0.049% | 0.074%(-0.025)#67 | 0.41%(-0.362)#4,737 |
| 68. | Livonia | 0.043% | 0.074%(-0.031)#68 | 0.41%(-0.367)#4,777 |
| 69. | Grosse Pointe Woods | 0.043% | 0.074%(-0.031)#69 | 0.41%(-0.367)#4,781 |
| 70. | Port Huron | 0.042% | 0.074%(-0.032)#70 | 0.41%(-0.369)#4,795 |
| 71. | Charlevoix | 0.040% | 0.074%(-0.034)#71 | 0.41%(-0.370)#4,804 |
| 72. | Portage | 0.039% | 0.074%(-0.035)#72 | 0.41%(-0.371)#4,819 |
| 73. | Flint | 0.037% | 0.074%(-0.037)#73 | 0.41%(-0.373)#4,841 |
| 74. | Detroit | 0.036% | 0.074%(-0.038)#74 | 0.41%(-0.374)#4,850 |
| 75. | Saginaw | 0.034% | 0.074%(-0.040)#75 | 0.41%(-0.376)#4,865 |
| 76. | Lincoln Park | 0.030% | 0.074%(-0.044)#76 | 0.41%(-0.380)#4,903 |
| 77. | Marquette | 0.029% | 0.074%(-0.045)#77 | 0.41%(-0.381)#4,913 |
| 78. | Muskegon | 0.029% | 0.074%(-0.045)#78 | 0.41%(-0.381)#4,916 |
| 79. | Southgate | 0.027% | 0.074%(-0.047)#79 | 0.41%(-0.383)#4,935 |
| 80. | Bloomfield Hills | 0.023% | 0.074%(-0.051)#80 | 0.41%(-0.387)#4,966 |
| 81. | Sterling Heights | 0.022% | 0.074%(-0.051)#81 | 0.41%(-0.388)#4,970 |
| 82. | Southfield | 0.017% | 0.074%(-0.057)#82 | 0.41%(-0.393)#5,003 |
| 83. | Dearborn Heights | 0.013% | 0.074%(-0.061)#83 | 0.41%(-0.397)#5,029 |
| 84. | St Joseph | 0.013% | 0.074%(-0.061)#84 | 0.41%(-0.397)#5,030 |
Common Questions
What are the Top 10 Cities with the Highest Percentage of Colombian Population in Michigan?
Top 10 Cities with the Highest Percentage of Colombian Population in Michigan are:
#1
2.11%
#2
1.76%
#3
1.48%
#4
1.23%
#5
1.15%
#6
0.92%
#7
0.90%
#8
0.89%
#9
0.82%
#10
0.81%
What city has the Highest Percentage of Colombian Population in Michigan?
Lake Linden has the Highest Percentage of Colombian Population in Michigan with 2.11%.
What is the Percentage of Colombian Population in the State of Michigan?
Percentage of Colombian Population in Michigan is 0.074%.
What is the Percentage of Colombian Population in the United States?
Percentage of Colombian Population in the United States is 0.41%.