Cities with the Highest Percentage of Colombian Population in Minnesota
RELATED REPORTS & OPTIONS
Colombian
Minnesota
Compare Cities
Map of Cities with the Highest Percentage of Colombian Population in Minnesota
0.00%
3.00%
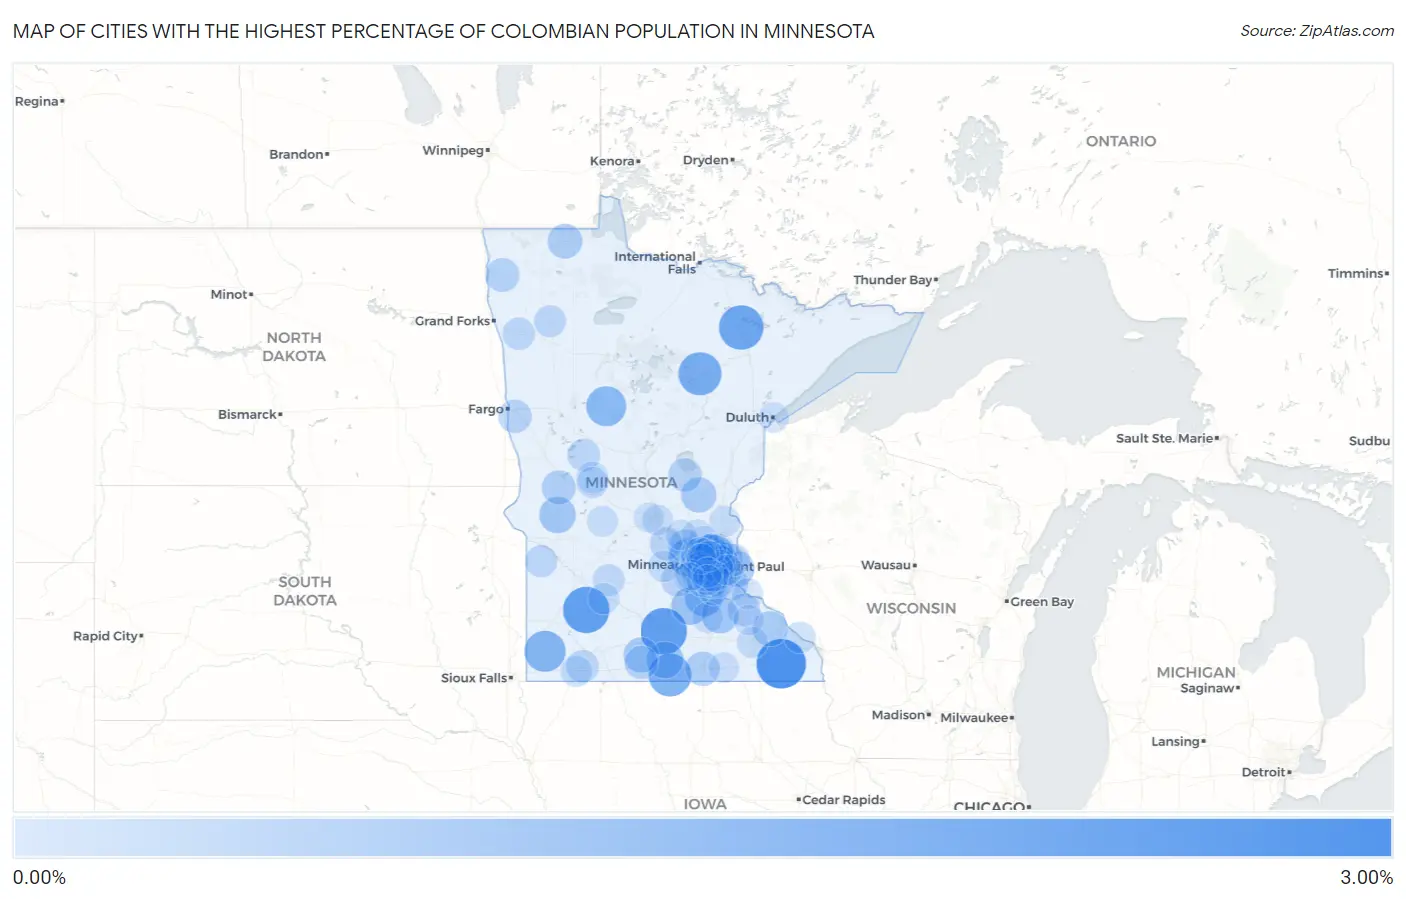
Cities with the Highest Percentage of Colombian Population in Minnesota
| City | Colombian | vs State | vs National | |
| 1. | Lanesboro | 2.65% | 0.12% (+2.54)#1 | 0.41% (+2.24)#416 |
| 2. | Skyline | 2.22% | 0.12% (+2.11)#2 | 0.41% (+1.81)#512 |
| 3. | Lucan | 2.21% | 0.12% (+2.09)#3 | 0.41% (+1.80)#516 |
| 4. | Cook | 1.96% | 0.12% (+1.84)#4 | 0.41% (+1.55)#582 |
| 5. | Bovey | 1.77% | 0.12% (+1.65)#5 | 0.41% (+1.36)#644 |
| 6. | Frost | 1.75% | 0.12% (+1.63)#6 | 0.41% (+1.34)#654 |
| 7. | Arden Hills | 1.74% | 0.12% (+1.63)#7 | 0.41% (+1.33)#657 |
| 8. | Edgerton | 1.51% | 0.12% (+1.40)#8 | 0.41% (+1.10)#766 |
| 9. | Mendota | 1.41% | 0.12% (+1.29)#9 | 0.41% (+0.998)#826 |
| 10. | Park Rapids | 1.35% | 0.12% (+1.23)#10 | 0.41% (+0.935)#869 |
| 11. | Elko New Market | 1.07% | 0.12% (+0.955)#11 | 0.41% (+0.662)#1,082 |
| 12. | Loretto | 1.07% | 0.12% (+0.948)#12 | 0.41% (+0.655)#1,088 |
| 13. | Montgomery | 0.99% | 0.12% (+0.875)#13 | 0.41% (+0.582)#1,149 |
| 14. | Lauderdale | 0.98% | 0.12% (+0.861)#14 | 0.41% (+0.568)#1,163 |
| 15. | Delavan | 0.94% | 0.12% (+0.826)#15 | 0.41% (+0.533)#1,190 |
| 16. | Nerstrand | 0.92% | 0.12% (+0.805)#16 | 0.41% (+0.512)#1,233 |
| 17. | Morris | 0.88% | 0.12% (+0.766)#17 | 0.41% (+0.473)#1,279 |
| 18. | St Marys Point | 0.86% | 0.12% (+0.739)#18 | 0.41% (+0.446)#1,322 |
| 19. | Spring Lake Park | 0.85% | 0.12% (+0.730)#19 | 0.41% (+0.437)#1,334 |
| 20. | Truman | 0.74% | 0.12% (+0.623)#20 | 0.41% (+0.330)#1,492 |
| 21. | Ogilvie | 0.73% | 0.12% (+0.613)#21 | 0.41% (+0.320)#1,515 |
| 22. | Plainview | 0.72% | 0.12% (+0.602)#22 | 0.41% (+0.309)#1,536 |
| 23. | Hilltop | 0.70% | 0.12% (+0.579)#23 | 0.41% (+0.286)#1,582 |
| 24. | Roseau | 0.66% | 0.12% (+0.542)#24 | 0.41% (+0.249)#1,645 |
| 25. | Columbia Heights | 0.65% | 0.12% (+0.529)#25 | 0.41% (+0.236)#1,670 |
| 26. | Albert Lea | 0.62% | 0.12% (+0.501)#26 | 0.41% (+0.208)#1,743 |
| 27. | Barrett | 0.57% | 0.12% (+0.451)#27 | 0.41% (+0.158)#1,865 |
| 28. | Vadnais Heights | 0.56% | 0.12% (+0.443)#28 | 0.41% (+0.150)#1,905 |
| 29. | Stephen | 0.54% | 0.12% (+0.426)#29 | 0.41% (+0.133)#1,949 |
| 30. | Hastings | 0.53% | 0.12% (+0.409)#30 | 0.41% (+0.116)#2,005 |
| 31. | St Michael | 0.50% | 0.12% (+0.387)#31 | 0.41% (+0.094)#2,060 |
| 32. | Onamia | 0.50% | 0.12% (+0.385)#32 | 0.41% (+0.092)#2,063 |
| 33. | Robbinsdale | 0.50% | 0.12% (+0.381)#33 | 0.41% (+0.088)#2,075 |
| 34. | Sabin | 0.48% | 0.12% (+0.368)#34 | 0.41% (+0.075)#2,108 |
| 35. | Northrop | 0.48% | 0.12% (+0.364)#35 | 0.41% (+0.071)#2,117 |
| 36. | Pine Springs | 0.45% | 0.12% (+0.334)#36 | 0.41% (+0.041)#2,212 |
| 37. | Cologne | 0.43% | 0.12% (+0.314)#37 | 0.41% (+0.021)#2,284 |
| 38. | St Louis Park | 0.41% | 0.12% (+0.291)#38 | 0.41% (-0.002)#2,373 |
| 39. | Goodhue | 0.41% | 0.12% (+0.289)#39 | 0.41% (-0.004)#2,379 |
| 40. | Maple Lake | 0.40% | 0.12% (+0.281)#40 | 0.41% (-0.012)#2,422 |
| 41. | Henning | 0.39% | 0.12% (+0.272)#41 | 0.41% (-0.021)#2,459 |
| 42. | Brewster | 0.37% | 0.12% (+0.256)#42 | 0.41% (-0.037)#2,520 |
| 43. | Crookston | 0.36% | 0.12% (+0.244)#43 | 0.41% (-0.049)#2,564 |
| 44. | Minnetonka | 0.36% | 0.12% (+0.240)#44 | 0.41% (-0.053)#2,587 |
| 45. | Golden Valley | 0.36% | 0.12% (+0.240)#45 | 0.41% (-0.053)#2,588 |
| 46. | St Anthony City Hennepin And Ramsey Counties | 0.32% | 0.12% (+0.204)#46 | 0.41% (-0.089)#2,737 |
| 47. | Madison | 0.32% | 0.12% (+0.202)#47 | 0.41% (-0.091)#2,748 |
| 48. | Oak Park Heights | 0.31% | 0.12% (+0.196)#48 | 0.41% (-0.097)#2,788 |
| 49. | Plummer | 0.31% | 0.12% (+0.191)#49 | 0.41% (-0.102)#2,814 |
| 50. | Olivia | 0.30% | 0.12% (+0.180)#50 | 0.41% (-0.113)#2,877 |
| 51. | Minneapolis | 0.28% | 0.12% (+0.168)#51 | 0.41% (-0.125)#2,943 |
| 52. | Apple Valley | 0.28% | 0.12% (+0.162)#52 | 0.41% (-0.131)#2,986 |
| 53. | North St Paul | 0.27% | 0.12% (+0.156)#53 | 0.41% (-0.137)#3,017 |
| 54. | Miltona | 0.25% | 0.12% (+0.134)#54 | 0.41% (-0.159)#3,132 |
| 55. | Carlos | 0.23% | 0.12% (+0.118)#55 | 0.41% (-0.175)#3,231 |
| 56. | Plymouth | 0.23% | 0.12% (+0.113)#56 | 0.41% (-0.180)#3,268 |
| 57. | Winona | 0.23% | 0.12% (+0.109)#57 | 0.41% (-0.184)#3,297 |
| 58. | Worthington | 0.22% | 0.12% (+0.107)#58 | 0.41% (-0.186)#3,311 |
| 59. | North Oaks | 0.21% | 0.12% (+0.095)#59 | 0.41% (-0.198)#3,391 |
| 60. | Eden Prairie | 0.21% | 0.12% (+0.092)#60 | 0.41% (-0.201)#3,408 |
| 61. | Little Canada | 0.21% | 0.12% (+0.090)#61 | 0.41% (-0.203)#3,419 |
| 62. | Winsted | 0.20% | 0.12% (+0.087)#62 | 0.41% (-0.206)#3,434 |
| 63. | Redwood Falls | 0.20% | 0.12% (+0.079)#63 | 0.41% (-0.214)#3,475 |
| 64. | Rochester | 0.19% | 0.12% (+0.072)#64 | 0.41% (-0.221)#3,527 |
| 65. | Savage | 0.18% | 0.12% (+0.068)#65 | 0.41% (-0.225)#3,556 |
| 66. | Nowthen | 0.18% | 0.12% (+0.060)#66 | 0.41% (-0.233)#3,617 |
| 67. | Red Wing | 0.17% | 0.12% (+0.057)#67 | 0.41% (-0.236)#3,634 |
| 68. | Maplewood | 0.17% | 0.12% (+0.057)#68 | 0.41% (-0.236)#3,637 |
| 69. | Brooten | 0.17% | 0.12% (+0.056)#69 | 0.41% (-0.237)#3,646 |
| 70. | Maple Grove | 0.17% | 0.12% (+0.056)#70 | 0.41% (-0.238)#3,650 |
| 71. | St Cloud | 0.15% | 0.12% (+0.031)#71 | 0.41% (-0.262)#3,825 |
| 72. | Andover | 0.15% | 0.12% (+0.030)#72 | 0.41% (-0.263)#3,839 |
| 73. | West St Paul | 0.14% | 0.12% (+0.027)#73 | 0.41% (-0.266)#3,872 |
| 74. | Faribault | 0.14% | 0.12% (+0.026)#74 | 0.41% (-0.267)#3,880 |
| 75. | Mendota Heights | 0.14% | 0.12% (+0.020)#75 | 0.41% (-0.273)#3,923 |
| 76. | North Branch | 0.14% | 0.12% (+0.020)#76 | 0.41% (-0.273)#3,927 |
| 77. | Brooklyn Center | 0.14% | 0.12% (+0.019)#77 | 0.41% (-0.274)#3,933 |
| 78. | Big Lake | 0.13% | 0.12% (+0.018)#78 | 0.41% (-0.275)#3,942 |
| 79. | Austin | 0.13% | 0.12% (+0.017)#79 | 0.41% (-0.276)#3,951 |
| 80. | Hopkins | 0.13% | 0.12% (+0.016)#80 | 0.41% (-0.277)#3,954 |
| 81. | Farmington | 0.13% | 0.12% (+0.011)#81 | 0.41% (-0.282)#4,002 |
| 82. | St Paul | 0.12% | 0.12% (+0.008)#82 | 0.41% (-0.285)#4,031 |
| 83. | Edina | 0.12% | 0.12% (+0.007)#83 | 0.41% (-0.286)#4,033 |
| 84. | Bloomington | 0.12% | 0.12% (+0.005)#84 | 0.41% (-0.288)#4,056 |
| 85. | Lino Lakes | 0.12% | 0.12% (+0.004)#85 | 0.41% (-0.289)#4,069 |
| 86. | Rosemount | 0.12% | 0.12% (+0.002)#86 | 0.41% (-0.291)#4,078 |
| 87. | Blaine | 0.12% | 0.12% (+0.001)#87 | 0.41% (-0.292)#4,085 |
| 88. | Chanhassen | 0.12% | 0.12% (-0.001)#88 | 0.41% (-0.294)#4,103 |
| 89. | Mazeppa | 0.11% | 0.12% (-0.006)#89 | 0.41% (-0.299)#4,148 |
| 90. | Woodbury | 0.11% | 0.12% (-0.010)#90 | 0.41% (-0.303)#4,185 |
| 91. | Brooklyn Park | 0.11% | 0.12% (-0.010)#91 | 0.41% (-0.303)#4,188 |
| 92. | Eagan | 0.10% | 0.12% (-0.013)#92 | 0.41% (-0.306)#4,212 |
| 93. | Fridley | 0.10% | 0.12% (-0.016)#93 | 0.41% (-0.309)#4,246 |
| 94. | Duluth | 0.098% | 0.12% (-0.019)#94 | 0.41% (-0.312)#4,265 |
| 95. | Osseo | 0.076% | 0.12% (-0.041)#95 | 0.41% (-0.334)#4,471 |
| 96. | New Hope | 0.074% | 0.12% (-0.043)#96 | 0.41% (-0.336)#4,490 |
| 97. | Richfield | 0.073% | 0.12% (-0.044)#97 | 0.41% (-0.337)#4,506 |
| 98. | Chaska | 0.072% | 0.12% (-0.045)#98 | 0.41% (-0.338)#4,518 |
| 99. | St Joseph | 0.071% | 0.12% (-0.046)#99 | 0.41% (-0.339)#4,533 |
| 100. | Burnsville | 0.070% | 0.12% (-0.047)#100 | 0.41% (-0.340)#4,540 |
Common Questions
What are the Top 10 Cities with the Highest Percentage of Colombian Population in Minnesota?
Top 10 Cities with the Highest Percentage of Colombian Population in Minnesota are:
#1
2.65%
#2
2.22%
#3
2.21%
#4
1.96%
#5
1.77%
#6
1.75%
#7
1.74%
#8
1.51%
#9
1.41%
#10
1.35%
What city has the Highest Percentage of Colombian Population in Minnesota?
Lanesboro has the Highest Percentage of Colombian Population in Minnesota with 2.65%.
What is the Percentage of Colombian Population in the State of Minnesota?
Percentage of Colombian Population in Minnesota is 0.12%.
What is the Percentage of Colombian Population in the United States?
Percentage of Colombian Population in the United States is 0.41%.