Cities with the Highest Percentage of Colombian Population in the United States
RELATED REPORTS & OPTIONS
Colombian
United States
Compare Cities
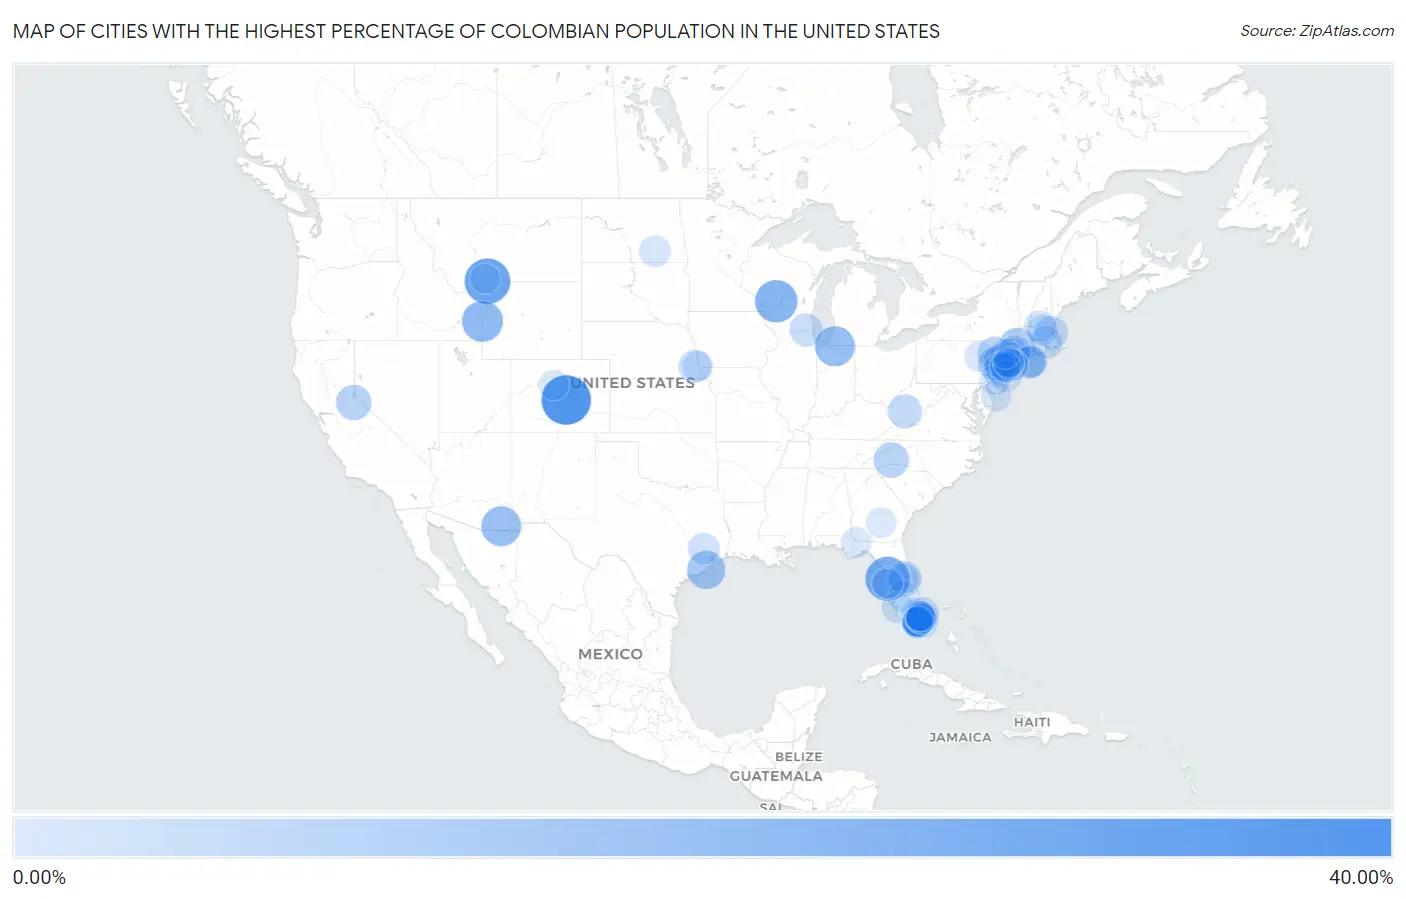
Map of Cities with the Highest Percentage of Colombian Population in the United States
0.00%
40.00%
Cities with the Highest Percentage of Colombian Population in the United States
| City | Colombian | vs State | vs National | |
| 1. | Midland | 39.22% | 0.20%(+39.0)#1 | 0.41%(+38.8)#1 |
| 2. | Jardine | 32.56% | 0.068%(+32.5)#1 | 0.41%(+32.1)#2 |
| 3. | Victory Gardens Borough | 31.69% | 1.53%(+30.2)#1 | 0.41%(+31.3)#3 |
| 4. | Quail Ridge | 29.74% | 1.97%(+27.8)#1 | 0.41%(+29.3)#4 |
| 5. | Wyeville | 26.72% | 0.093%(+26.6)#1 | 0.41%(+26.3)#5 |
| 6. | Moonachie Borough | 24.77% | 1.53%(+23.2)#2 | 0.41%(+24.4)#6 |
| 7. | Freedom | 24.19% | 0.10%(+24.1)#1 | 0.41%(+23.8)#7 |
| 8. | Indian Village | 22.56% | 0.078%(+22.5)#1 | 0.41%(+22.1)#8 |
| 9. | Mcneal | 22.22% | 0.16%(+22.1)#1 | 0.41%(+21.8)#9 |
| 10. | Quintana | 19.51% | 0.33%(+19.2)#1 | 0.41%(+19.1)#10 |
| 11. | New Preston | 17.15% | 0.81%(+16.3)#1 | 0.41%(+16.7)#11 |
| 12. | Cataula | 15.80% | 0.35%(+15.5)#1 | 0.41%(+15.4)#12 |
| 13. | Wharton Borough | 15.69% | 1.53%(+14.2)#3 | 0.41%(+15.3)#13 |
| 14. | Dover | 15.30% | 1.53%(+13.8)#4 | 0.41%(+14.9)#14 |
| 15. | Kirkwood | 14.86% | 0.26%(+14.6)#1 | 0.41%(+14.4)#15 |
| 16. | Meadow Woods | 14.68% | 1.97%(+12.7)#2 | 0.41%(+14.3)#16 |
| 17. | Chimney Rock Village | 14.55% | 0.28%(+14.3)#1 | 0.41%(+14.1)#17 |
| 18. | Sunrise Lake | 13.01% | 0.22%(+12.8)#1 | 0.41%(+12.6)#18 |
| 19. | Key Biscayne | 12.89% | 1.97%(+10.9)#3 | 0.41%(+12.5)#19 |
| 20. | Yorktown Heights | 12.86% | 0.90%(+12.0)#1 | 0.41%(+12.4)#20 |
| 21. | Country Club | 12.65% | 1.97%(+10.7)#4 | 0.41%(+12.2)#21 |
| 22. | Sunny Isles Beach | 12.52% | 1.97%(+10.5)#5 | 0.41%(+12.1)#22 |
| 23. | Ojus | 12.51% | 1.97%(+10.5)#6 | 0.41%(+12.1)#23 |
| 24. | Doral | 12.39% | 1.97%(+10.4)#7 | 0.41%(+12.0)#24 |
| 25. | Smithers | 12.17% | 0.027%(+12.1)#1 | 0.41%(+11.8)#25 |
| 26. | Anderson | 12.05% | 1.53%(+10.5)#5 | 0.41%(+11.6)#26 |
| 27. | North Bay Village | 11.68% | 1.97%(+9.70)#8 | 0.41%(+11.3)#27 |
| 28. | Weston | 11.23% | 1.97%(+9.25)#9 | 0.41%(+10.8)#28 |
| 29. | Lily Lake | 11.13% | 0.093%(+11.0)#2 | 0.41%(+10.7)#29 |
| 30. | Lauderdale By The Sea | 10.87% | 1.97%(+8.89)#10 | 0.41%(+10.5)#30 |
| 31. | Revere | 10.70% | 0.58%(+10.1)#1 | 0.41%(+10.3)#31 |
| 32. | Dunbar | 10.45% | 0.098%(+10.4)#1 | 0.41%(+10.0)#32 |
| 33. | Aventura | 10.43% | 1.97%(+8.45)#11 | 0.41%(+10.0)#33 |
| 34. | Elizabeth | 10.36% | 1.53%(+8.84)#6 | 0.41%(+9.95)#34 |
| 35. | Elmsford | 10.23% | 0.90%(+9.33)#2 | 0.41%(+9.82)#35 |
| 36. | Skillman | 10.10% | 1.53%(+8.57)#7 | 0.41%(+9.69)#36 |
| 37. | Hampton Bays | 10.01% | 0.90%(+9.11)#3 | 0.41%(+9.60)#37 |
| 38. | Central Falls | 9.74% | 1.06%(+8.68)#1 | 0.41%(+9.33)#38 |
| 39. | Totowa Borough | 9.71% | 1.53%(+8.19)#8 | 0.41%(+9.30)#39 |
| 40. | East Quogue | 9.50% | 0.90%(+8.60)#4 | 0.41%(+9.09)#40 |
| 41. | Fairfield | 9.50% | 0.27%(+9.22)#1 | 0.41%(+9.09)#41 |
| 42. | Shinnecock Hills | 9.32% | 0.90%(+8.42)#5 | 0.41%(+8.91)#42 |
| 43. | Brewster Hill | 9.31% | 0.90%(+8.41)#6 | 0.41%(+8.90)#43 |
| 44. | Kenvil | 9.29% | 1.53%(+7.76)#9 | 0.41%(+8.88)#44 |
| 45. | Virginia Gardens | 9.22% | 1.97%(+7.24)#12 | 0.41%(+8.81)#45 |
| 46. | Woodloch | 9.15% | 0.33%(+8.82)#2 | 0.41%(+8.74)#46 |
| 47. | Fountainebleau | 9.02% | 1.97%(+7.04)#13 | 0.41%(+8.61)#47 |
| 48. | Bellerose Terrace | 8.52% | 0.90%(+7.62)#7 | 0.41%(+8.11)#48 |
| 49. | Jud | 8.51% | 0.11%(+8.40)#1 | 0.41%(+8.10)#49 |
| 50. | Lake Placid | 8.47% | 1.97%(+6.50)#14 | 0.41%(+8.06)#50 |
| 51. | East Millstone | 8.32% | 1.53%(+6.79)#10 | 0.41%(+7.91)#51 |
| 52. | Page Park | 8.29% | 1.97%(+6.32)#15 | 0.41%(+7.88)#52 |
| 53. | Odessa | 8.25% | 1.97%(+6.28)#16 | 0.41%(+7.84)#53 |
| 54. | Glenvar Heights | 8.23% | 1.97%(+6.25)#17 | 0.41%(+7.82)#54 |
| 55. | The Hammocks | 8.21% | 1.97%(+6.24)#18 | 0.41%(+7.80)#55 |
| 56. | Greenville | 8.20% | 0.17%(+8.03)#1 | 0.41%(+7.79)#56 |
| 57. | Harrison | 8.17% | 1.53%(+6.64)#11 | 0.41%(+7.76)#57 |
| 58. | South Floral Park | 8.09% | 0.90%(+7.19)#8 | 0.41%(+7.68)#58 |
| 59. | Shirley | 8.02% | 0.58%(+7.44)#2 | 0.41%(+7.61)#59 |
| 60. | Penbrook Borough | 7.99% | 0.22%(+7.77)#2 | 0.41%(+7.58)#60 |
| 61. | Richmond West | 7.88% | 1.97%(+5.91)#19 | 0.41%(+7.47)#61 |
| 62. | Three Lakes | 7.83% | 1.97%(+5.86)#20 | 0.41%(+7.42)#62 |
| 63. | Kendall West | 7.81% | 1.97%(+5.84)#21 | 0.41%(+7.40)#63 |
| 64. | Finderne | 7.75% | 1.53%(+6.23)#12 | 0.41%(+7.34)#64 |
| 65. | Hamburg Borough | 7.51% | 1.53%(+5.99)#13 | 0.41%(+7.10)#65 |
| 66. | Country Walk | 7.47% | 1.97%(+5.50)#22 | 0.41%(+7.06)#66 |
| 67. | Pembroke Pines | 7.37% | 1.97%(+5.40)#23 | 0.41%(+6.96)#67 |
| 68. | Mill Bay | 7.33% | 0.27%(+7.06)#1 | 0.41%(+6.92)#68 |
| 69. | Sunrise | 7.33% | 1.97%(+5.35)#24 | 0.41%(+6.92)#69 |
| 70. | Sheatown | 7.31% | 0.22%(+7.09)#3 | 0.41%(+6.90)#70 |
| 71. | South Miami | 7.29% | 1.97%(+5.32)#25 | 0.41%(+6.88)#71 |
| 72. | Ramtown | 7.29% | 1.53%(+5.76)#14 | 0.41%(+6.88)#72 |
| 73. | Englewood | 7.25% | 1.53%(+5.73)#15 | 0.41%(+6.84)#73 |
| 74. | The Crossings | 7.22% | 1.97%(+5.25)#26 | 0.41%(+6.81)#74 |
| 75. | Whitesboro | 7.13% | 1.53%(+5.60)#16 | 0.41%(+6.72)#75 |
| 76. | Coplay Borough | 7.11% | 0.22%(+6.89)#4 | 0.41%(+6.70)#76 |
| 77. | Leonia Borough | 7.01% | 1.53%(+5.48)#17 | 0.41%(+6.60)#77 |
| 78. | Kingston Estates | 7.00% | 1.53%(+5.47)#18 | 0.41%(+6.59)#78 |
| 79. | Sewaren | 6.98% | 1.53%(+5.45)#19 | 0.41%(+6.57)#79 |
| 80. | Golden Beach | 6.93% | 1.97%(+4.96)#27 | 0.41%(+6.52)#80 |
| 81. | Southchase | 6.89% | 1.97%(+4.92)#28 | 0.41%(+6.48)#81 |
| 82. | West New York | 6.83% | 1.53%(+5.30)#20 | 0.41%(+6.42)#82 |
| 83. | Jacksonville | 6.80% | 0.35%(+6.45)#2 | 0.41%(+6.39)#83 |
| 84. | Bogota Borough | 6.73% | 1.53%(+5.21)#21 | 0.41%(+6.32)#84 |
| 85. | Kendale Lakes | 6.71% | 1.97%(+4.74)#29 | 0.41%(+6.30)#85 |
| 86. | Bay Harbor Islands | 6.71% | 1.97%(+4.73)#30 | 0.41%(+6.30)#86 |
| 87. | Nebraska City | 6.68% | 0.098%(+6.59)#2 | 0.41%(+6.27)#87 |
| 88. | Dillon | 6.62% | 0.20%(+6.42)#2 | 0.41%(+6.21)#88 |
| 89. | Shillington Borough | 6.60% | 0.22%(+6.38)#5 | 0.41%(+6.19)#89 |
| 90. | Biscayne Park | 6.58% | 1.97%(+4.61)#31 | 0.41%(+6.17)#90 |
| 91. | Greensboro | 6.56% | 1.97%(+4.59)#32 | 0.41%(+6.15)#91 |
| 92. | Linden | 6.50% | 1.53%(+4.98)#22 | 0.41%(+6.09)#92 |
| 93. | Lodi Borough | 6.48% | 1.53%(+4.96)#23 | 0.41%(+6.07)#93 |
| 94. | Corwin Springs | 6.45% | 0.068%(+6.38)#2 | 0.41%(+6.04)#94 |
| 95. | Northdale | 6.45% | 1.97%(+4.47)#33 | 0.41%(+6.04)#95 |
| 96. | Lebanon Borough | 6.44% | 1.53%(+4.91)#24 | 0.41%(+6.03)#96 |
| 97. | Hollywood | 6.42% | 1.97%(+4.45)#34 | 0.41%(+6.01)#97 |
| 98. | Davie | 6.37% | 1.97%(+4.39)#35 | 0.41%(+5.96)#98 |
| 99. | Ridgefield Park | 6.27% | 1.53%(+4.74)#25 | 0.41%(+5.86)#99 |
| 100. | Walton Park | 6.23% | 0.90%(+5.33)#9 | 0.41%(+5.82)#100 |
Common Questions
What are the Top 10 Cities with the Highest Percentage of Colombian Population in the United States?
Top 10 Cities with the Highest Percentage of Colombian Population in the United States are:
What city has the Highest Percentage of Colombian Population in the United States?
Midland has the Highest Percentage of Colombian Population in the United States with 39.22%.
What is the Percentage of Colombian Population in the United States?
Percentage of Colombian Population in the United States is 0.41%.