Cities with the Highest Percentage of Colombian Population in New York
RELATED REPORTS & OPTIONS
Colombian
New York
Compare Cities
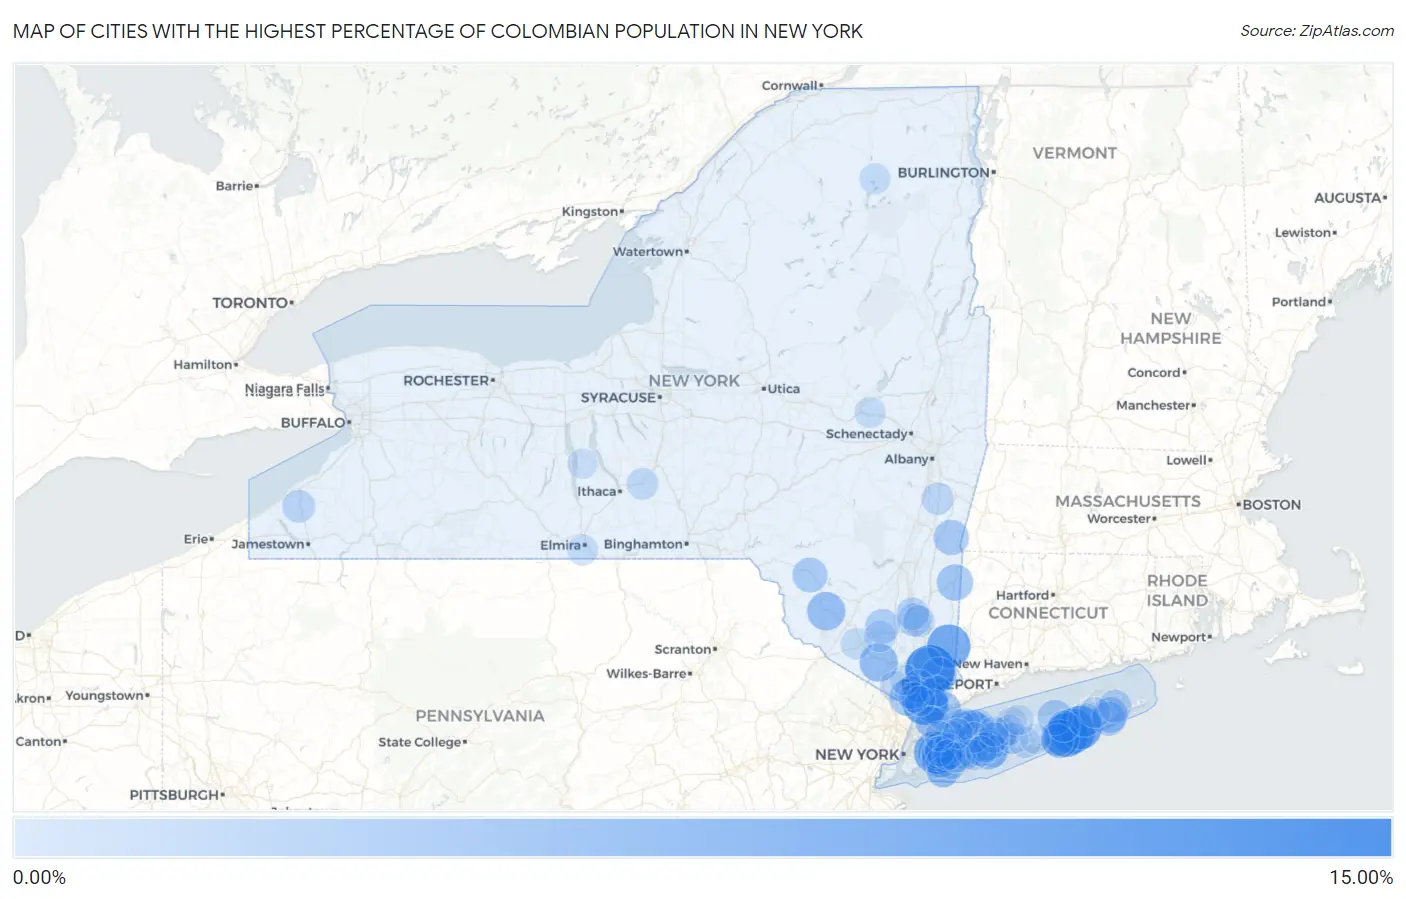
Map of Cities with the Highest Percentage of Colombian Population in New York
0.00%
15.00%
Cities with the Highest Percentage of Colombian Population in New York
| City | Colombian | vs State | vs National | |
| 1. | Yorktown Heights | 12.86% | 0.90%(+12.0)#1 | 0.41%(+12.4)#20 |
| 2. | Elmsford | 10.23% | 0.90%(+9.33)#2 | 0.41%(+9.82)#35 |
| 3. | Hampton Bays | 10.01% | 0.90%(+9.11)#3 | 0.41%(+9.60)#37 |
| 4. | East Quogue | 9.50% | 0.90%(+8.60)#4 | 0.41%(+9.09)#40 |
| 5. | Shinnecock Hills | 9.32% | 0.90%(+8.42)#5 | 0.41%(+8.91)#42 |
| 6. | Brewster Hill | 9.31% | 0.90%(+8.41)#6 | 0.41%(+8.90)#43 |
| 7. | Bellerose Terrace | 8.52% | 0.90%(+7.62)#7 | 0.41%(+8.11)#48 |
| 8. | South Floral Park | 8.09% | 0.90%(+7.19)#8 | 0.41%(+7.68)#58 |
| 9. | Walton Park | 6.23% | 0.90%(+5.33)#9 | 0.41%(+5.82)#100 |
| 10. | Monticello | 6.16% | 0.90%(+5.26)#10 | 0.41%(+5.75)#103 |
| 11. | Quiogue | 6.10% | 0.90%(+5.20)#11 | 0.41%(+5.69)#105 |
| 12. | Greenlawn | 5.72% | 0.90%(+4.81)#12 | 0.41%(+5.31)#114 |
| 13. | Port Chester | 5.59% | 0.90%(+4.69)#13 | 0.41%(+5.18)#117 |
| 14. | West Nyack | 5.28% | 0.90%(+4.38)#14 | 0.41%(+4.87)#136 |
| 15. | Bay Shore | 5.08% | 0.90%(+4.18)#15 | 0.41%(+4.67)#147 |
| 16. | Amenia | 5.05% | 0.90%(+4.15)#16 | 0.41%(+4.64)#150 |
| 17. | Bedford Hills | 4.69% | 0.90%(+3.79)#17 | 0.41%(+4.28)#169 |
| 18. | Halesite | 4.68% | 0.90%(+3.78)#18 | 0.41%(+4.27)#171 |
| 19. | Copake Lake | 4.53% | 0.90%(+3.63)#19 | 0.41%(+4.12)#181 |
| 20. | East Hampton North | 4.51% | 0.90%(+3.61)#20 | 0.41%(+4.10)#185 |
| 21. | Riverhead | 4.42% | 0.90%(+3.52)#21 | 0.41%(+4.01)#192 |
| 22. | Livingston Manor | 4.29% | 0.90%(+3.39)#22 | 0.41%(+3.88)#202 |
| 23. | Hicksville | 4.26% | 0.90%(+3.36)#23 | 0.41%(+3.85)#207 |
| 24. | Walden | 4.07% | 0.90%(+3.17)#24 | 0.41%(+3.66)#223 |
| 25. | East Hampton | 3.86% | 0.90%(+2.96)#25 | 0.41%(+3.45)#245 |
| 26. | Sleepy Hollow | 3.84% | 0.90%(+2.94)#26 | 0.41%(+3.43)#247 |
| 27. | White Plains | 3.83% | 0.90%(+2.93)#27 | 0.41%(+3.42)#248 |
| 28. | Island Park | 3.82% | 0.90%(+2.92)#28 | 0.41%(+3.41)#250 |
| 29. | North Sea | 3.49% | 0.90%(+2.58)#29 | 0.41%(+3.08)#291 |
| 30. | Tuxedo | 3.48% | 0.90%(+2.58)#30 | 0.41%(+3.07)#292 |
| 31. | Islandia | 3.31% | 0.90%(+2.41)#31 | 0.41%(+2.90)#311 |
| 32. | Ossining | 3.24% | 0.90%(+2.34)#32 | 0.41%(+2.83)#322 |
| 33. | Springs | 3.22% | 0.90%(+2.32)#33 | 0.41%(+2.81)#324 |
| 34. | Wappingers Falls | 3.13% | 0.90%(+2.23)#34 | 0.41%(+2.72)#334 |
| 35. | Cassadaga | 3.09% | 0.90%(+2.19)#35 | 0.41%(+2.68)#349 |
| 36. | Valley Stream | 3.04% | 0.90%(+2.14)#36 | 0.41%(+2.63)#354 |
| 37. | North Valley Stream | 3.02% | 0.90%(+2.12)#37 | 0.41%(+2.61)#357 |
| 38. | Larchmont | 2.98% | 0.90%(+2.08)#38 | 0.41%(+2.57)#363 |
| 39. | Valley Cottage | 2.98% | 0.90%(+2.08)#39 | 0.41%(+2.57)#364 |
| 40. | Crown Heights | 2.97% | 0.90%(+2.07)#40 | 0.41%(+2.56)#366 |
| 41. | Brookville | 2.95% | 0.90%(+2.04)#41 | 0.41%(+2.54)#371 |
| 42. | Kinderhook | 2.81% | 0.90%(+1.91)#42 | 0.41%(+2.40)#390 |
| 43. | Westhampton Beach | 2.77% | 0.90%(+1.87)#43 | 0.41%(+2.36)#397 |
| 44. | Brentwood | 2.75% | 0.90%(+1.85)#44 | 0.41%(+2.34)#400 |
| 45. | Nesconset | 2.72% | 0.90%(+1.81)#45 | 0.41%(+2.31)#405 |
| 46. | West Hempstead | 2.70% | 0.90%(+1.80)#46 | 0.41%(+2.29)#408 |
| 47. | Islip | 2.70% | 0.90%(+1.79)#47 | 0.41%(+2.29)#410 |
| 48. | Elmont | 2.67% | 0.90%(+1.77)#48 | 0.41%(+2.26)#413 |
| 49. | Westbury | 2.64% | 0.90%(+1.74)#49 | 0.41%(+2.23)#418 |
| 50. | Myers Corner | 2.62% | 0.90%(+1.72)#50 | 0.41%(+2.21)#420 |
| 51. | Levittown | 2.62% | 0.90%(+1.71)#51 | 0.41%(+2.21)#421 |
| 52. | Northport | 2.51% | 0.90%(+1.61)#52 | 0.41%(+2.10)#439 |
| 53. | Centre Island | 2.49% | 0.90%(+1.58)#53 | 0.41%(+2.08)#446 |
| 54. | East Farmingdale | 2.47% | 0.90%(+1.56)#54 | 0.41%(+2.06)#450 |
| 55. | Manhasset Hills | 2.46% | 0.90%(+1.56)#55 | 0.41%(+2.05)#454 |
| 56. | Dryden | 2.45% | 0.90%(+1.55)#56 | 0.41%(+2.04)#457 |
| 57. | Floral Park | 2.43% | 0.90%(+1.53)#57 | 0.41%(+2.02)#464 |
| 58. | Old Brookville | 2.40% | 0.90%(+1.50)#58 | 0.41%(+1.99)#469 |
| 59. | South Farmingdale | 2.40% | 0.90%(+1.49)#59 | 0.41%(+1.99)#471 |
| 60. | Flanders | 2.34% | 0.90%(+1.44)#60 | 0.41%(+1.93)#483 |
| 61. | North Bay Shore | 2.31% | 0.90%(+1.41)#61 | 0.41%(+1.90)#491 |
| 62. | North Wantagh | 2.30% | 0.90%(+1.40)#62 | 0.41%(+1.89)#494 |
| 63. | Maybrook | 2.30% | 0.90%(+1.40)#63 | 0.41%(+1.89)#496 |
| 64. | Armonk | 2.24% | 0.90%(+1.34)#64 | 0.41%(+1.83)#506 |
| 65. | Middletown | 2.22% | 0.90%(+1.32)#65 | 0.41%(+1.81)#513 |
| 66. | North Bellport | 2.15% | 0.90%(+1.24)#66 | 0.41%(+1.74)#529 |
| 67. | Paul Smiths | 2.11% | 0.90%(+1.21)#67 | 0.41%(+1.70)#537 |
| 68. | Lloyd Harbor | 2.10% | 0.90%(+1.20)#68 | 0.41%(+1.69)#541 |
| 69. | Southport | 2.06% | 0.90%(+1.16)#69 | 0.41%(+1.65)#549 |
| 70. | Carle Place | 2.05% | 0.90%(+1.15)#70 | 0.41%(+1.64)#551 |
| 71. | Tribes Hill | 2.03% | 0.90%(+1.13)#71 | 0.41%(+1.62)#561 |
| 72. | Holtsville | 2.02% | 0.90%(+1.11)#72 | 0.41%(+1.61)#567 |
| 73. | Long Beach | 2.02% | 0.90%(+1.11)#73 | 0.41%(+1.61)#568 |
| 74. | Freeport | 1.99% | 0.90%(+1.09)#74 | 0.41%(+1.58)#573 |
| 75. | North Lindenhurst | 1.98% | 0.90%(+1.08)#75 | 0.41%(+1.57)#576 |
| 76. | Noyack | 1.96% | 0.90%(+1.06)#76 | 0.41%(+1.55)#583 |
| 77. | Port Jefferson Station | 1.94% | 0.90%(+1.04)#77 | 0.41%(+1.53)#592 |
| 78. | South Huntington | 1.93% | 0.90%(+1.03)#78 | 0.41%(+1.52)#598 |
| 79. | New Rochelle | 1.85% | 0.90%(+0.953)#79 | 0.41%(+1.44)#613 |
| 80. | Centereach | 1.83% | 0.90%(+0.930)#80 | 0.41%(+1.42)#620 |
| 81. | Uniondale | 1.83% | 0.90%(+0.924)#81 | 0.41%(+1.42)#625 |
| 82. | Lynbrook | 1.82% | 0.90%(+0.916)#82 | 0.41%(+1.41)#626 |
| 83. | Hauppauge | 1.81% | 0.90%(+0.912)#83 | 0.41%(+1.40)#629 |
| 84. | Wesley Hills | 1.76% | 0.90%(+0.862)#84 | 0.41%(+1.35)#647 |
| 85. | East Norwich | 1.73% | 0.90%(+0.831)#85 | 0.41%(+1.32)#661 |
| 86. | West Haverstraw | 1.72% | 0.90%(+0.817)#86 | 0.41%(+1.31)#668 |
| 87. | Mastic | 1.72% | 0.90%(+0.816)#87 | 0.41%(+1.31)#670 |
| 88. | Baywood | 1.70% | 0.90%(+0.797)#88 | 0.41%(+1.29)#677 |
| 89. | North Babylon | 1.66% | 0.90%(+0.757)#89 | 0.41%(+1.25)#689 |
| 90. | Lodi | 1.65% | 0.90%(+0.749)#90 | 0.41%(+1.24)#693 |
| 91. | Miller Place | 1.65% | 0.90%(+0.744)#91 | 0.41%(+1.24)#695 |
| 92. | New Hyde Park | 1.64% | 0.90%(+0.740)#92 | 0.41%(+1.23)#697 |
| 93. | Hempstead | 1.64% | 0.90%(+0.738)#93 | 0.41%(+1.23)#699 |
| 94. | Cadyville | 1.64% | 0.90%(+0.738)#94 | 0.41%(+1.23)#701 |
| 95. | North Bellmore | 1.62% | 0.90%(+0.722)#95 | 0.41%(+1.21)#710 |
| 96. | Nyack | 1.62% | 0.90%(+0.714)#96 | 0.41%(+1.21)#715 |
| 97. | Tarrytown | 1.59% | 0.90%(+0.687)#97 | 0.41%(+1.18)#723 |
| 98. | Smithtown | 1.56% | 0.90%(+0.662)#98 | 0.41%(+1.15)#733 |
| 99. | Port Washington | 1.55% | 0.90%(+0.650)#99 | 0.41%(+1.14)#738 |
| 100. | Jefferson Valley Yorktown | 1.55% | 0.90%(+0.648)#100 | 0.41%(+1.14)#741 |
Common Questions
What are the Top 10 Cities with the Highest Percentage of Colombian Population in New York?
Top 10 Cities with the Highest Percentage of Colombian Population in New York are:
#1
12.86%
#2
10.23%
#3
10.01%
#4
9.50%
#5
9.32%
#6
9.31%
#7
8.52%
#8
8.09%
#9
6.23%
#10
6.16%
What city has the Highest Percentage of Colombian Population in New York?
Yorktown Heights has the Highest Percentage of Colombian Population in New York with 12.86%.
What is the Percentage of Colombian Population in the State of New York?
Percentage of Colombian Population in New York is 0.90%.
What is the Percentage of Colombian Population in the United States?
Percentage of Colombian Population in the United States is 0.41%.