Cities with the Most Immigrants from Indonesia in Pennsylvania
RELATED REPORTS & OPTIONS
Indonesia
Pennsylvania
Compare Cities
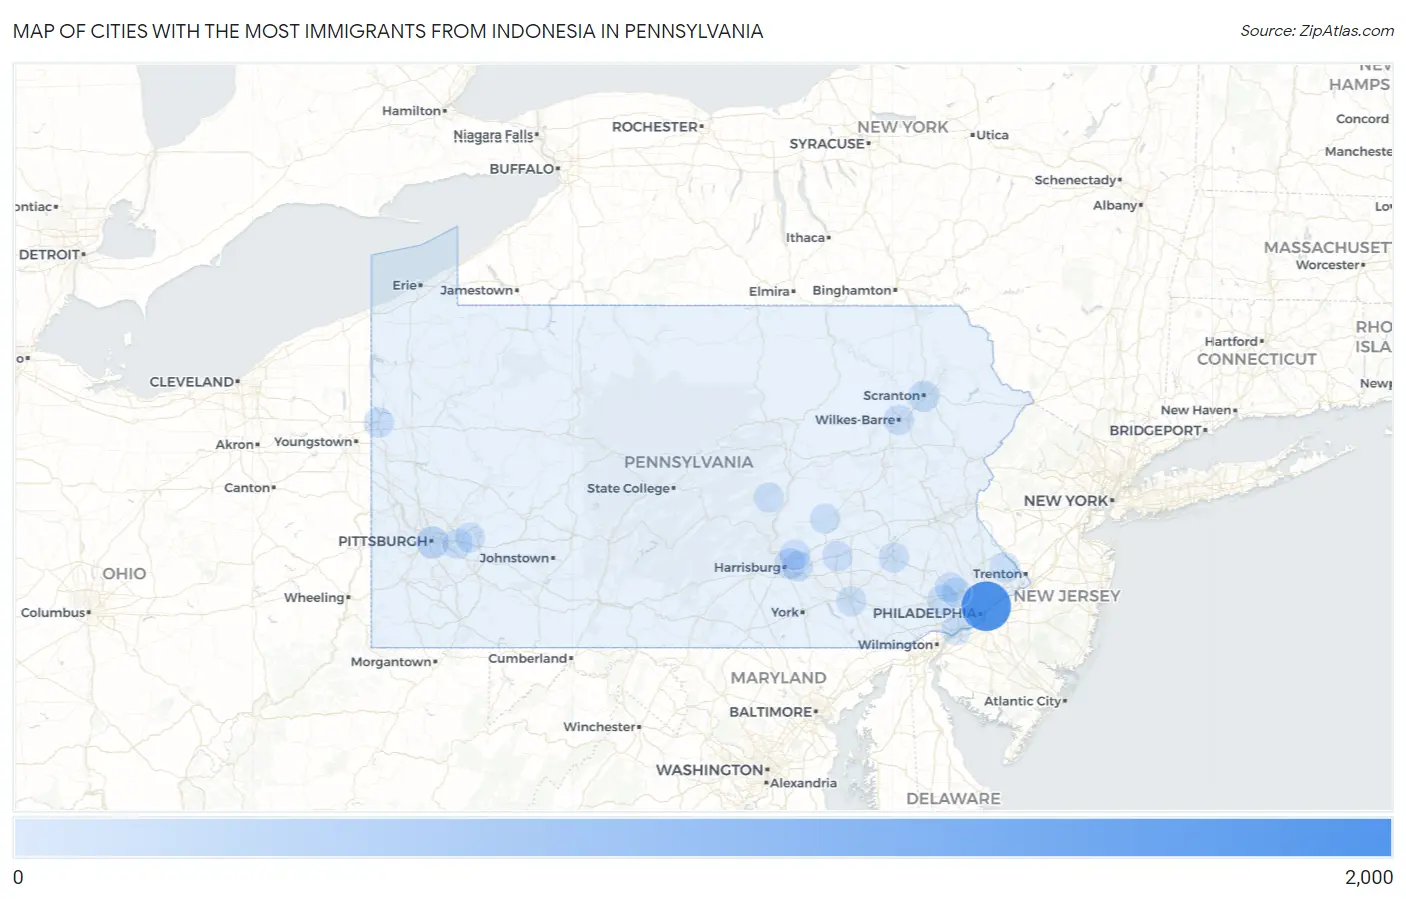
Map of Cities with the Most Immigrants from Indonesia in Pennsylvania
0
2,000
Cities with the Most Immigrants from Indonesia in Pennsylvania
| City | Indonesia | vs State | vs National | |
| 1. | Philadelphia | 1,977 | 3,736(52.92%)#1 | 99,615(1.98%)#3 |
| 2. | Pittsburgh | 231 | 3,736(6.18%)#2 | 99,615(0.23%)#74 |
| 3. | Scranton | 115 | 3,736(3.08%)#3 | 99,615(0.12%)#162 |
| 4. | Progress | 77 | 3,736(2.06%)#4 | 99,615(0.08%)#248 |
| 5. | Rutherford | 56 | 3,736(1.50%)#5 | 99,615(0.06%)#346 |
| 6. | Collingdale Borough | 53 | 3,736(1.42%)#6 | 99,615(0.05%)#366 |
| 7. | Phoenixville Borough | 49 | 3,736(1.31%)#7 | 99,615(0.05%)#391 |
| 8. | Paoli | 47 | 3,736(1.26%)#8 | 99,615(0.05%)#410 |
| 9. | Lebanon | 43 | 3,736(1.15%)#9 | 99,615(0.04%)#441 |
| 10. | Linglestown | 42 | 3,736(1.12%)#10 | 99,615(0.04%)#455 |
| 11. | Wilkes Barre | 36 | 3,736(0.96%)#11 | 99,615(0.04%)#500 |
| 12. | Indiana Borough | 30 | 3,736(0.80%)#12 | 99,615(0.03%)#574 |
| 13. | Monroeville | 23 | 3,736(0.62%)#13 | 99,615(0.02%)#681 |
| 14. | Richlandtown Borough | 22 | 3,736(0.59%)#14 | 99,615(0.02%)#709 |
| 15. | Hermitage | 21 | 3,736(0.56%)#15 | 99,615(0.02%)#721 |
| 16. | Athens Borough | 21 | 3,736(0.56%)#16 | 99,615(0.02%)#724 |
| 17. | Folcroft Borough | 19 | 3,736(0.51%)#17 | 99,615(0.02%)#772 |
| 18. | Chester | 18 | 3,736(0.48%)#18 | 99,615(0.02%)#781 |
| 19. | Glenolden Borough | 15 | 3,736(0.40%)#19 | 99,615(0.02%)#884 |
| 20. | Highspire Borough | 14 | 3,736(0.37%)#20 | 99,615(0.01%)#920 |
| 21. | Downingtown Borough | 12 | 3,736(0.32%)#21 | 99,615(0.01%)#981 |
| 22. | Reading | 11 | 3,736(0.29%)#22 | 99,615(0.01%)#993 |
| 23. | Hanover Borough | 10 | 3,736(0.27%)#23 | 99,615(0.01%)#1,065 |
| 24. | King Of Prussia | 9 | 3,736(0.24%)#24 | 99,615(0.01%)#1,114 |
| 25. | Reinerton | 9 | 3,736(0.24%)#25 | 99,615(0.01%)#1,145 |
| 26. | Audubon | 8 | 3,736(0.21%)#26 | 99,615(0.01%)#1,185 |
| 27. | Lancaster | 7 | 3,736(0.19%)#27 | 99,615(0.01%)#1,209 |
| 28. | Mount Pleasant Mills | 6 | 3,736(0.16%)#28 | 99,615(0.01%)#1,296 |
| 29. | Murrysville | 5 | 3,736(0.13%)#29 | 99,615(0.01%)#1,316 |
| 30. | Newtown Grant | 5 | 3,736(0.13%)#30 | 99,615(0.01%)#1,327 |
| 31. | Emsworth Borough | 4 | 3,736(0.11%)#31 | 99,615(0.00%)#1,366 |
| 32. | Freedom Borough | 4 | 3,736(0.11%)#32 | 99,615(0.00%)#1,374 |
| 33. | Bell Acres Borough | 4 | 3,736(0.11%)#33 | 99,615(0.00%)#1,375 |
| 34. | West Conshohocken Borough | 4 | 3,736(0.11%)#34 | 99,615(0.00%)#1,376 |
| 35. | Loganton Borough | 4 | 3,736(0.11%)#35 | 99,615(0.00%)#1,383 |
| 36. | Alburtis Borough | 3 | 3,736(0.08%)#36 | 99,615(0.00%)#1,404 |
| 37. | Shiremanstown Borough | 2 | 3,736(0.05%)#37 | 99,615(0.00%)#1,440 |
| 38. | Rockwood Borough | 2 | 3,736(0.05%)#38 | 99,615(0.00%)#1,448 |
| 39. | Rose Valley Borough | 1 | 3,736(0.03%)#39 | 99,615(0.00%)#1,481 |
| 40. | Ford Cliff Borough | 1 | 3,736(0.03%)#40 | 99,615(0.00%)#1,488 |
Common Questions
What are the Top 10 Cities with the Most Immigrants from Indonesia in Pennsylvania?
Top 10 Cities with the Most Immigrants from Indonesia in Pennsylvania are:
#1
1,977
#2
231
#3
115
#4
77
#5
56
#6
47
#7
43
#8
42
#9
36
#10
23
What city has the Most Immigrants from Indonesia in Pennsylvania?
Philadelphia has the Most Immigrants from Indonesia in Pennsylvania with 1,977.
What is the Total Immigrants from Indonesia in the State of Pennsylvania?
Total Immigrants from Indonesia in Pennsylvania is 3,736.
What is the Total Immigrants from Indonesia in the United States?
Total Immigrants from Indonesia in the United States is 99,615.