Cities with the Highest Percentage of Mexican Population in Virginia
RELATED REPORTS & OPTIONS
Mexican
Virginia
Compare Cities
Map of Cities with the Highest Percentage of Mexican Population in Virginia
0.00%
60.00%
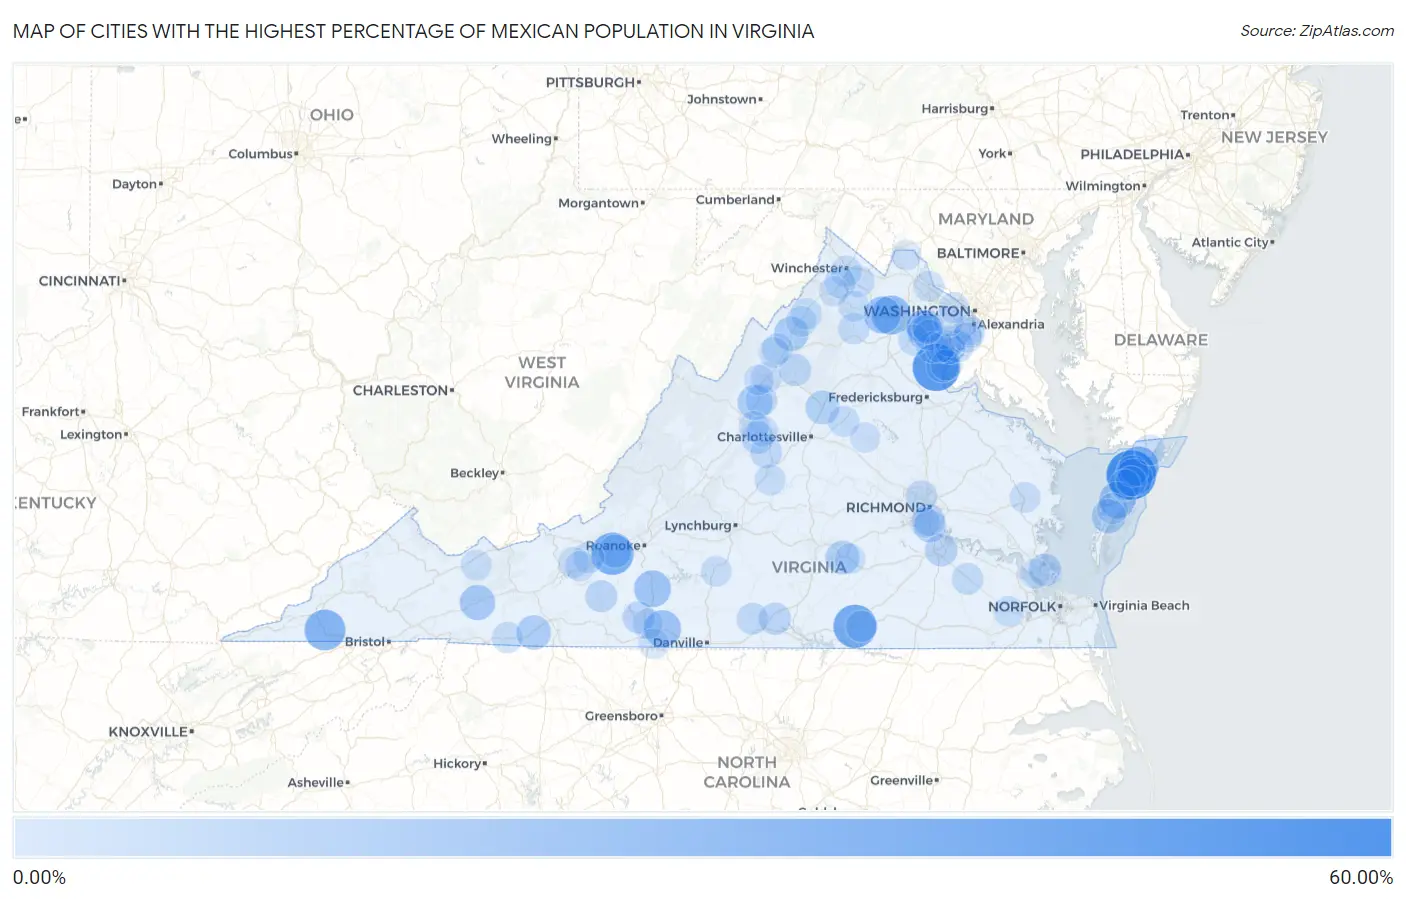
Cities with the Highest Percentage of Mexican Population in Virginia
| City | Mexican | vs State | vs National | |
| 1. | Chase Crossing | 52.79% | 2.23%(+50.6)#1 | 11.22%(+41.6)#1,060 |
| 2. | Boswell S Corner | 46.75% | 2.23%(+44.5)#2 | 11.22%(+35.5)#1,257 |
| 3. | La Crosse | 36.28% | 2.23%(+34.0)#3 | 11.22%(+25.1)#1,697 |
| 4. | Elliston | 34.16% | 2.23%(+31.9)#4 | 11.22%(+22.9)#1,834 |
| 5. | Clinchport | 30.30% | 2.23%(+28.1)#5 | 11.22%(+19.1)#2,102 |
| 6. | Nelsonia | 27.07% | 2.23%(+24.8)#6 | 11.22%(+15.9)#2,363 |
| 7. | The Plains | 25.64% | 2.23%(+23.4)#7 | 11.22%(+14.4)#2,483 |
| 8. | Disputanta | 23.67% | 2.23%(+21.4)#8 | 11.22%(+12.4)#2,669 |
| 9. | Pastoria | 22.08% | 2.23%(+19.8)#9 | 11.22%(+10.9)#2,819 |
| 10. | Laurel Park | 20.74% | 2.23%(+18.5)#10 | 11.22%(+9.52)#2,965 |
| 11. | Marshall | 20.54% | 2.23%(+18.3)#11 | 11.22%(+9.32)#2,994 |
| 12. | Henry Fork | 20.18% | 2.23%(+17.9)#12 | 11.22%(+8.96)#3,058 |
| 13. | Painter | 19.67% | 2.23%(+17.4)#13 | 11.22%(+8.45)#3,120 |
| 14. | Linville | 19.13% | 2.23%(+16.9)#14 | 11.22%(+7.91)#3,194 |
| 15. | Atkins | 16.44% | 2.23%(+14.2)#15 | 11.22%(+5.22)#3,618 |
| 16. | Mount Sidney | 15.44% | 2.23%(+13.2)#16 | 11.22%(+4.22)#3,803 |
| 17. | Kincora | 15.14% | 2.23%(+12.9)#17 | 11.22%(+3.92)#3,858 |
| 18. | Hiltons | 14.81% | 2.23%(+12.6)#18 | 11.22%(+3.59)#3,919 |
| 19. | Keezletown | 14.79% | 2.23%(+12.6)#19 | 11.22%(+3.57)#3,925 |
| 20. | Loch Lomond | 14.78% | 2.23%(+12.5)#20 | 11.22%(+3.56)#3,931 |
| 21. | Mount Jackson | 14.51% | 2.23%(+12.3)#21 | 11.22%(+3.29)#3,997 |
| 22. | Galax | 14.37% | 2.23%(+12.1)#22 | 11.22%(+3.15)#4,031 |
| 23. | Nassawadox | 13.75% | 2.23%(+11.5)#23 | 11.22%(+2.53)#4,173 |
| 24. | Ruckersville | 12.78% | 2.23%(+10.6)#24 | 11.22%(+1.57)#4,396 |
| 25. | Burkeville | 12.78% | 2.23%(+10.6)#25 | 11.22%(+1.56)#4,397 |
| 26. | Lafayette | 11.00% | 2.23%(+8.76)#26 | 11.22%(-0.222)#4,899 |
| 27. | Manassas | 10.75% | 2.23%(+8.51)#27 | 11.22%(-0.473)#4,984 |
| 28. | Bethel Manor | 10.15% | 2.23%(+7.92)#28 | 11.22%(-1.07)#5,191 |
| 29. | Fort Lee | 10.11% | 2.23%(+7.88)#29 | 11.22%(-1.11)#5,205 |
| 30. | Port Republic | 9.91% | 2.23%(+7.68)#30 | 11.22%(-1.31)#5,288 |
| 31. | Bellwood | 9.58% | 2.23%(+7.35)#31 | 11.22%(-1.63)#5,418 |
| 32. | Sudley | 9.44% | 2.23%(+7.21)#32 | 11.22%(-1.78)#5,481 |
| 33. | Lyndhurst | 9.09% | 2.23%(+6.85)#33 | 11.22%(-2.13)#5,628 |
| 34. | Quantico Base | 9.05% | 2.23%(+6.81)#34 | 11.22%(-2.17)#5,653 |
| 35. | Bensley | 9.00% | 2.23%(+6.77)#35 | 11.22%(-2.22)#5,669 |
| 36. | Scottsburg | 8.87% | 2.23%(+6.64)#36 | 11.22%(-2.35)#5,718 |
| 37. | Yorkshire | 8.69% | 2.23%(+6.46)#37 | 11.22%(-2.53)#5,804 |
| 38. | Mason Neck | 8.59% | 2.23%(+6.36)#38 | 11.22%(-2.63)#5,850 |
| 39. | Camp Barrett | 8.43% | 2.23%(+6.20)#39 | 11.22%(-2.79)#5,930 |
| 40. | Floyd | 8.42% | 2.23%(+6.19)#40 | 11.22%(-2.80)#5,936 |
| 41. | Shenandoah | 8.41% | 2.23%(+6.18)#41 | 11.22%(-2.81)#5,947 |
| 42. | Bassett | 8.33% | 2.23%(+6.10)#42 | 11.22%(-2.89)#5,979 |
| 43. | Weyers Cave | 8.09% | 2.23%(+5.86)#43 | 11.22%(-3.13)#6,123 |
| 44. | Nellysford | 7.81% | 2.23%(+5.57)#44 | 11.22%(-3.41)#6,278 |
| 45. | Dumbarton | 7.75% | 2.23%(+5.52)#45 | 11.22%(-3.47)#6,312 |
| 46. | Potomac Mills | 7.74% | 2.23%(+5.51)#46 | 11.22%(-3.48)#6,317 |
| 47. | Mountain Road | 7.61% | 2.23%(+5.38)#47 | 11.22%(-3.61)#6,385 |
| 48. | Waverly | 7.44% | 2.23%(+5.21)#48 | 11.22%(-3.78)#6,486 |
| 49. | Independent Hill | 6.80% | 2.23%(+4.56)#49 | 11.22%(-4.42)#6,856 |
| 50. | Boyce | 6.59% | 2.23%(+4.36)#50 | 11.22%(-4.63)#7,000 |
| 51. | Flint Hill | 6.58% | 2.23%(+4.35)#51 | 11.22%(-4.64)#7,005 |
| 52. | Brodnax | 6.58% | 2.23%(+4.34)#52 | 11.22%(-4.64)#7,006 |
| 53. | Woodstock | 6.57% | 2.23%(+4.34)#53 | 11.22%(-4.65)#7,010 |
| 54. | Parksley | 6.41% | 2.23%(+4.18)#54 | 11.22%(-4.81)#7,130 |
| 55. | Winchester | 6.36% | 2.23%(+4.13)#55 | 11.22%(-4.86)#7,167 |
| 56. | Stephens City | 6.31% | 2.23%(+4.08)#56 | 11.22%(-4.91)#7,212 |
| 57. | Independence | 6.29% | 2.23%(+4.06)#57 | 11.22%(-4.93)#7,230 |
| 58. | Onley | 6.25% | 2.23%(+4.02)#58 | 11.22%(-4.97)#7,259 |
| 59. | Timberville | 6.17% | 2.23%(+3.94)#59 | 11.22%(-5.05)#7,322 |
| 60. | Merrimac | 6.11% | 2.23%(+3.87)#60 | 11.22%(-5.11)#7,358 |
| 61. | Gordonsville | 6.01% | 2.23%(+3.78)#61 | 11.22%(-5.21)#7,424 |
| 62. | Nokesville | 5.85% | 2.23%(+3.62)#62 | 11.22%(-5.37)#7,554 |
| 63. | Occoquan | 5.78% | 2.23%(+3.55)#63 | 11.22%(-5.44)#7,604 |
| 64. | Exmore | 5.73% | 2.23%(+3.50)#64 | 11.22%(-5.49)#7,645 |
| 65. | Quantico | 5.71% | 2.23%(+3.48)#65 | 11.22%(-5.51)#7,676 |
| 66. | Shipman | 5.69% | 2.23%(+3.46)#66 | 11.22%(-5.52)#7,692 |
| 67. | Fairlawn | 5.58% | 2.23%(+3.35)#67 | 11.22%(-5.64)#7,792 |
| 68. | Hurt | 5.44% | 2.23%(+3.21)#68 | 11.22%(-5.78)#7,912 |
| 69. | Harrisonburg | 5.44% | 2.23%(+3.20)#69 | 11.22%(-5.78)#7,916 |
| 70. | Saluda | 5.38% | 2.23%(+3.15)#70 | 11.22%(-5.83)#7,963 |
| 71. | Apple Mountain Lake | 5.37% | 2.23%(+3.13)#71 | 11.22%(-5.85)#7,978 |
| 72. | Waynesboro | 5.33% | 2.23%(+3.10)#72 | 11.22%(-5.89)#8,025 |
| 73. | University Center | 5.26% | 2.23%(+3.02)#73 | 11.22%(-5.96)#8,097 |
| 74. | Broadway | 5.21% | 2.23%(+2.97)#74 | 11.22%(-6.01)#8,149 |
| 75. | Edinburg | 5.15% | 2.23%(+2.91)#75 | 11.22%(-6.07)#8,195 |
| 76. | Windsor | 5.14% | 2.23%(+2.90)#76 | 11.22%(-6.08)#8,206 |
| 77. | Collinsville | 5.09% | 2.23%(+2.86)#77 | 11.22%(-6.13)#8,255 |
| 78. | North Garden | 5.08% | 2.23%(+2.85)#78 | 11.22%(-6.14)#8,265 |
| 79. | Gratton | 5.02% | 2.23%(+2.78)#79 | 11.22%(-6.20)#8,333 |
| 80. | Plum Creek | 4.97% | 2.23%(+2.73)#80 | 11.22%(-6.25)#8,389 |
| 81. | Buckhall | 4.97% | 2.23%(+2.73)#81 | 11.22%(-6.25)#8,390 |
| 82. | Hybla Valley | 4.84% | 2.23%(+2.61)#82 | 11.22%(-6.38)#8,504 |
| 83. | Crewe | 4.67% | 2.23%(+2.44)#83 | 11.22%(-6.54)#8,702 |
| 84. | Ridgeway | 4.66% | 2.23%(+2.42)#84 | 11.22%(-6.56)#8,718 |
| 85. | Fishersville | 4.62% | 2.23%(+2.38)#85 | 11.22%(-6.60)#8,760 |
| 86. | Groveton | 4.60% | 2.23%(+2.36)#86 | 11.22%(-6.62)#8,790 |
| 87. | Wattsville | 4.59% | 2.23%(+2.36)#87 | 11.22%(-6.62)#8,793 |
| 88. | Dayton | 4.54% | 2.23%(+2.31)#88 | 11.22%(-6.68)#8,854 |
| 89. | Woodbridge | 4.52% | 2.23%(+2.29)#89 | 11.22%(-6.70)#8,882 |
| 90. | Tysons | 4.43% | 2.23%(+2.20)#90 | 11.22%(-6.79)#8,973 |
| 91. | Meadowbrook | 4.34% | 2.23%(+2.11)#91 | 11.22%(-6.87)#9,065 |
| 92. | Dale City | 4.31% | 2.23%(+2.08)#92 | 11.22%(-6.91)#9,104 |
| 93. | Louisa | 4.28% | 2.23%(+2.05)#93 | 11.22%(-6.94)#9,144 |
| 94. | Mount Vernon | 4.16% | 2.23%(+1.92)#94 | 11.22%(-7.06)#9,271 |
| 95. | Lovettsville | 4.13% | 2.23%(+1.89)#95 | 11.22%(-7.09)#9,315 |
| 96. | Long Branch | 4.13% | 2.23%(+1.89)#96 | 11.22%(-7.09)#9,316 |
| 97. | Newport News | 3.92% | 2.23%(+1.69)#97 | 11.22%(-7.30)#9,535 |
| 98. | Middletown | 3.85% | 2.23%(+1.62)#98 | 11.22%(-7.37)#9,623 |
| 99. | Manassas Park | 3.82% | 2.23%(+1.59)#99 | 11.22%(-7.40)#9,658 |
| 100. | Accomac | 3.77% | 2.23%(+1.54)#100 | 11.22%(-7.45)#9,719 |
Common Questions
What are the Top 10 Cities with the Highest Percentage of Mexican Population in Virginia?
Top 10 Cities with the Highest Percentage of Mexican Population in Virginia are:
#1
52.79%
#2
46.75%
#3
36.28%
#4
34.16%
#5
30.30%
#6
27.07%
#7
25.64%
#8
22.08%
#9
20.74%
#10
20.54%
What city has the Highest Percentage of Mexican Population in Virginia?
Chase Crossing has the Highest Percentage of Mexican Population in Virginia with 52.79%.
What is the Percentage of Mexican Population in the State of Virginia?
Percentage of Mexican Population in Virginia is 2.23%.
What is the Percentage of Mexican Population in the United States?
Percentage of Mexican Population in the United States is 11.22%.